University applications statistics for 2022 to 2024 were finally released late last week, giving us another data source on demand for higher education.
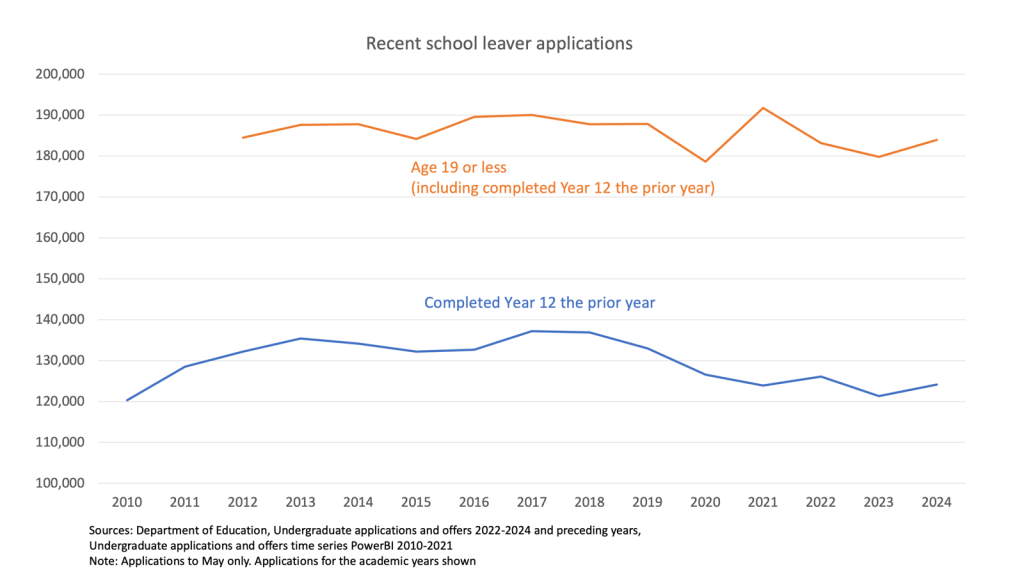
This post focuses on recent school leavers. The chart below shows that applications for this group were up in 2024 on 2023, but that the slump in applications since the late 2010s remained evident – other than the spike for academic year 2021, which is only apparent for teenagers who finished school prior to 2020. This is consistent with people deciding to sit out the COVID recession at university.
That COVID spike meant that in 2021 an unusually large share – 35% – of the 19 and under applicant group were not people who had finished school the year before. This share was 32.5% in each of 2023 and 2024, higher than any year 2012 to 2020, when it averaged 28.4%. This could mean that we are seeing more young people delaying higher education. This data source does not, however, distinguish between people who delayed applying until one or two years after finishing school, and people who enrolled but reapplied to change university and/or course.
Rates of application
Despite the small increase in applicants for the 2024 academic year who finished Year 12 in 2023, the share of Year 12s making an application continued its decline. This is because the number of Year 12s increased by more than the number of Year 12 applicants.
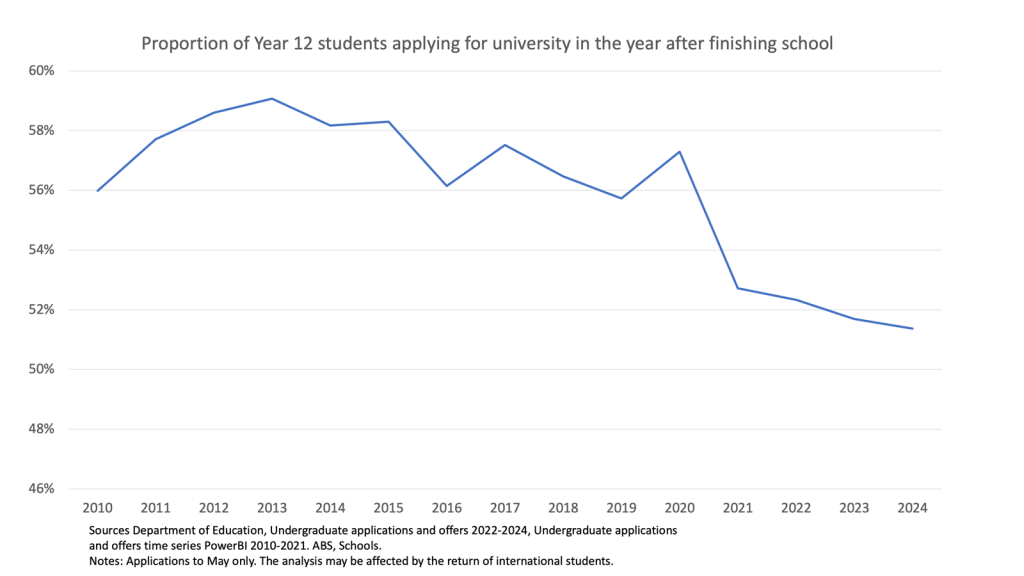
This data, however, is only applications to May, missing the second semester intake. In the good old days (2018 and before), the Department used to publish half-year enrolment data. In 2018 the first half year data for commencing domestic undergraduates was 82% of the final number. While first semester is clearly the main intake, full-year application rates are probably higher than shown in the chart. If there has been a trend towards applying for second rather than first semester, the decline in Year 12 application rates would be lower than shown.
The ATAR profile of school leaver applicants
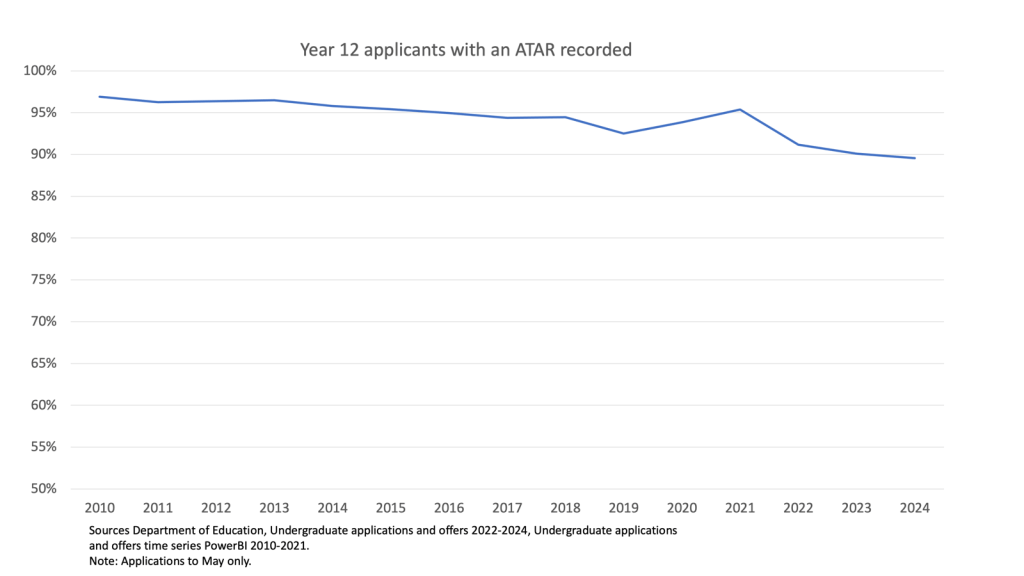
Any analysis of the ATAR profile of school leaver applicants must also be caveated. The share of applicants who completed Year 12 with an ATAR has dropped over time, to about 90%. This does not mean that ATAR was used in 90% of applications, just that the applicant had an ATAR.
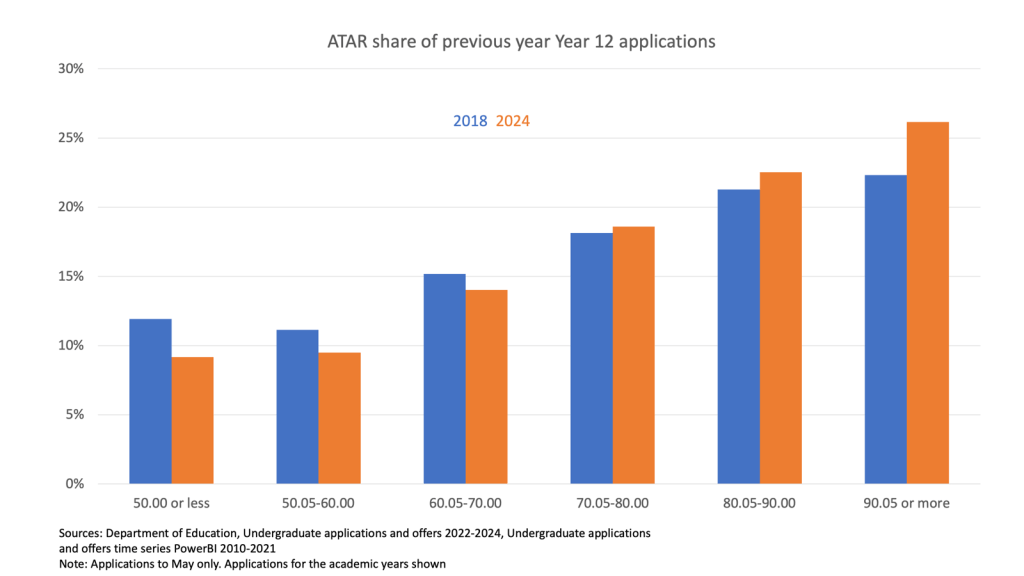
Year 12s on track for a low ATAR are probably least likely to pursue one, especially as they know that some universities don’t require an ATAR. That is a major caveat on the chart below looking at the distribution of applicant ATARs between ATAR bands. We cannot tell for sure whether the declining application share of ATARs below 70 is due to fewer ATARs being recorded for this group, or they have become less likely to apply. However, given lower-ATAR students have a higher risk of non-completion than other students, pursuing lower-risk alternatives to higher education would make sense.
Conclusion
All the data sources I use to track domestic student interest in higher education are, in various ways, defective for this task. Delayed applications may reveal higher demand than reported in this post. But putting the applications evidence together with my analysis of participation rates at age 19, and my explanations for why declining participation might be happening, I believe it is probable that we have seen a significant loss of school leaver interest in higher education since the mid-to-late 2010s.
Update: For mature age demand see this post.
