Measuring low SES and higher education policy

Australian higher education policy uses a geographic proxy to measure socioeconomic status. People living in the lowest 25% of areas by the ABS Index of Education and Occupation are deemed ‘low SES’.

The IEO is one of four SES measures devised by the ABS using census results. The other three are the Index of Relative Socio-economic Disadvantage (IRSD), the Index of Relative Socio-economic Advantage and Disadvantage (IRSAD), and the Index of Economic Resources (IER).

During the Senate inquiry into the new funding legislation Greens Senator Mehreen Faruqi, drawing on the University of Sydney’s submission which said it used IRSAD for awarding scholarships, asked witnesses about possible use of IRSAD instead. Senator David Pocock also asked about SES indicators for the ACT, which has few low SES students on the official definition.

I was one of several people to receive a written question on notice on equity definitions. This post draws on my response.

Predicting educational disadvantage

The chart below shows 2021 educational participation rates at age 20 by the four ABS SES indicators. Like the higher education version it uses SA1 areas, which on average contain about 400 people. I used census longitudinal data to capture SES when these students were aged 15 in 2016. This is a more reliable indicator of their formative years than current location, which could reflect a move closer to a university. A weakness of the funding bill currently in the Parliament is that its SES proxy is the student’s current address.

As a predictor of educational participation the IEO is the most powerful of the four. Parental education and occupation indicators show the largest high-low gaps. Young adults in the top decile are 4.2 times as likely to be at university than young adults in the lowest decile. The Index of Economic Resources is the least predictive, with top decile residents 2.3 times as likely to be at university as the lowest decile.

For outreach programs I can see merit in the IEO, to counteract absent university role models and possibly low parental expectations of higher education.

Read More »
How will the government finance more higher education enrolments?

The government has grand hopes for additional higher education participation, on the way to 80% tertiary attainment by 2050. But how they will fund enrolment growth is much less clear.

The government is setting itself a double challenge – not just delivering more domestic student places but simultaneously reducing ‘over-enrolments’, student contribution only places with no public subsidy. In a May provider briefing, ATEC put the number of over-enrolled places in 2026 at about 60,000.

On calculations in my Senate inquiry submission I estimated that, on 2025 numbers, maximum over-enrolment capacity under the government’s restrictions would be about 22,500 – on the unlikely assumption that every university could precisely use its full allowance.

With a low over-enrolment cap the government needs at least 37,500 additional fully-funded places just to maintain 2026 enrolments. That would cost taxpayers around $500 million without creating a single additional place.

The government has delayed this expense with transition arrangements for currently over-enrolled universities, but that is the goal they have set themselves.

How many new places has the government promised?

In his second reading speech for the funding reform bill, Jason Clare said that ‘next year there will be 16,000 more places for more students in the system. The year after that there will be another 16,000. The year after that another 16,000. In 2030, this increases to 19,000 additional fully funded Commonwealth supported places.’

While I would not necessarily take this at face value – the minister’s statements don’t always match reality – ‘more places for more students’ implies places over-and-above the conversion of over-enrolment places, although for the many universities that are already over-enrolled it’s hard to do that without also adjusting up their over-enrolment ‘glidepath’.

In the May provider briefing ATEC says it has 37,000 CSPs to allocate in 2027, of which 7,000 are already committed to the nuclear submarine program, regional study hubs and non-Table A providers. That leaves 30,000 places. In the provider briefing they talk about 15,000 to 20,000 of the 30,000 going to convert over-enrolments to fully-funded places. But to align with the minister’s 16,000 ‘more places for more students’ the over-enrolment conversions should be more like 14,000 places.

What do the Budget papers say?

Under the new funding bill, the Commonwealth Grant Scheme will continue funding the Commonwealth contribution component of Commonwealth supported places. Budget projections on the CGS are currently our best guide to future funding.

Read More »

The proposed new funding system, part 3: Capping over-enrolments

The Universities Accord (Opening the Doors of Opportunity) Bill 2026, in itself, does not do what it says in the cover.

Although the minister’s promotional material focuses on new Commonwealth supported places expected over coming years he could have funded those under the current system – albeit imprecisely, as the current system largely allocates in dollars rather than places. The most we can say in favour of the bill and new places is that it will be more obvious whether or not they have been funded.

Where the bill differs most from the current funding system is in reducing places at the university level. In the previous post I explained how a year of under-enrolment could result in a lower allocation of places two years later. In today’s post I describe proposed new restrictions on over-enrolments, students taken above the allocated level.

All legislative references in the following text are to the Higher Education Support Act 2003 unless otherwise specified, ‘current’ signalling the legislation now in force, ‘new’ signalling the amending bill.

As with the earlier posts, this is one is dealing with complex legislation so I am happy to receive feedback through comments or direct communication.

The current system

Under the current ‘higher education courses’ grant – all CSP categories other than medicine or Indigenous students in demand driven places – there is a maximum basic grant amount. The value of CSPs delivered in this category is calculated as the Commonwealth contribution rate * the number of student places delivered. If the value of these places exceeds the MBGA the university gets the MBGA but no more: current section 33-5(2). In 2024 nine universities delivered student places worth at least 5% more than their MBGA.

For student contributions, however, there is no cap. The provisions on upfront student contributions and HECS-HELP loans give the Commonwealth no power to intervene on these payments: current sections 93-15 and 96-1 respectively.

The proposed system capped student contributions

There will be a transitional scheme for currently over-enrolled universities, which I cover below. First I will focus on the long-run system under which universities will get an over-enrolment buffer, for which student contributions are paid, but then be penalised student contribution revenue for places in excess of the buffer.

Read More »

The proposed new funding system, part 1: Setting the number of fully-funded Commonwealth supported places

This post is the first in a series of explainers on how the new Commonwealth supported student funding system will operate if the Universities Accord (Opening the Doors of Opportunity) Bill 2026 is passed.

The series is primarily aimed at policy advisers and people working in university planning offices. I covered the most important issue for the general public and prospective university students in this Conversation article.

This post looks at how the total number of fully-funded Commonwealth supported places will be determined. A fully-funded place is one for which both a Commonwealth and a student contribution is paid. Student contribution only places will be discussed in a later post.

The current system

As a refresher, the current CSP allocation system has three components:

  • Designated courses, where the minister allocates, via university funding agreements, specific number of CSPs. Currently only medicine for non-Indigenous students is designated. The funding formula is the Commonwealth contribution rate * the number of student places delivered or the allocated number of places, whichever is the lower.
  • Demand driven courses, currently only Indigenous students in bachelor degrees or medical courses. The funding formula is the Commonwealth contribution rate * the number of student places delivered. Effectively, universities and students decide on the allocation.
  • A ‘higher education courses’ grant in which each university gets a maximum basic grant amount (MBGA) to cover CSPs not in the previous two categories. The value of CSPs delivered in this category is calculated as the Commonwealth contribution rate * the number of student places delivered. If the value of these places exceeds the MBGA the university gets the MBGA. If the value is below the MBGA in theory the university receives that amount. In practice, in recent years, universities have received the full value of their MBGA via other programs despite not delivering CSPs of the required value.

The proposed reforms

All three of these components will change if the bill passes.

The overall higher education courses category will be allocated in CSPs instead of dollars, with no maximum basic grant amount. Total places will be determined by the minister, allocations to specific providers will be determined by ATEC.

Designated places will become a sub-category of higher education courses, used to allocate/restrict places in specific kinds of courses. While the minister decides which courses are designated, ATEC allocates designated places to providers.

Medicine will move into a new, separate category, still functionally equivalent to designation but allocated by the minister (as now) instead of ATEC.

The existing demand driven categories will be maintained and include a ministerial discretion to add new categories of courses. There will be a new mechanism to cap demand driven places if needed.

Read More »

Trends in domestic postgraduate coursework education

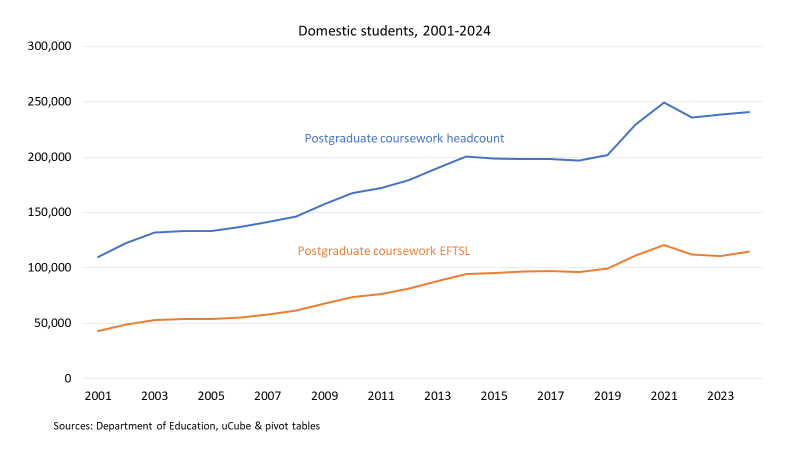
I have a paper coming out soon, co-authored with Ren-Hao Xu, on the rise of Commonwealth supported places in postgraduate coursework degrees. It is another in our series on university decision-making under Job-ready Graduates. This post provides more general background on domestic postgraduate coursework trends.

Key points:

  • Despite a return to headcount growth following a mid-to-late 2010s stall, domestic PG coursework enrolments are declining as a % of the main potential market, the bachelor-degree holding population.
  • On a full-time equivalent student basis the largest domestic PG coursework enrolments by field are in education, business and health. Growth over the last decade is concentrated in health, social work and IT.
  • PG coursework had a 63.6% female enrolment share in 2024. The large health and education fields are highly feminised. The female enrolment share is increasing in most other broad fields of education.
  • Two-step bachelor/masters entry to professional occupations is making the PG coursework population younger.
  • More PG coursework is being delivered online, a likely cause of increased rates of part-time study.
  • In line with 2020s enrolment trends, course completions are increasing. Many migrants also have postgraduate qualifications. As a result the postgraduate share of the workforce is increasing.

Why do students enrol in postgraduate coursework degrees?

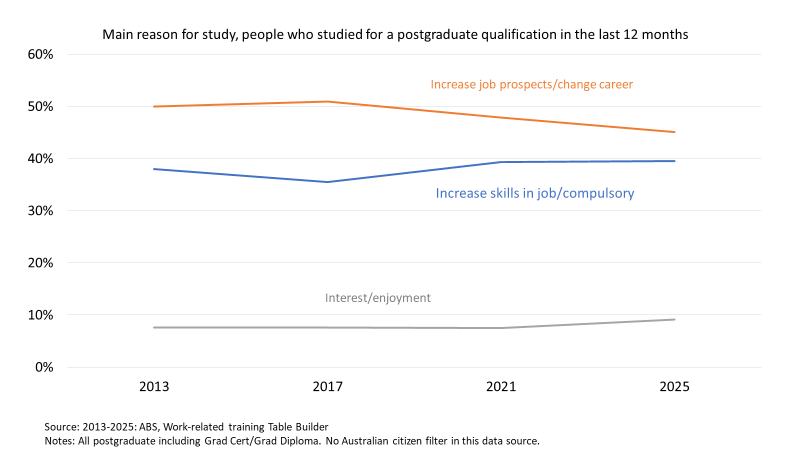
In the ABS work-related training survey students mainly give job-related reasons for taking a postgraduate coursework degree. Since 2017 more students take degrees for reasons relating to their current job, compared to seeking a career change or a better job.

Trends in overall domestic postgraduate enrolments

In the mid-to-late 2010s we saw a multi-year plateau in postgraduate coursework enrolments, at around 200,000. Then, in a likely example of higher education’s counter-cyclical relationship with the labour market, enrolments increased significantly in 2020 and 2021. As jobs returned enrolments eased off, but remained above 2019 levels.

Read More »

What is going on with low SES higher education numbers?

In his speech to the Universities Australia conference last month Jason Clare complained that the low SES share of enrolments ‘hasn’t changed that much in the last 30 years.’ He is overly pessimistic about long run trends in low SES higher education participation. But after 2017 key indicators went backwards, until a recent stabilisation with signs of partial recovery. This post explores trends and speculates on causes.

School leaver participation

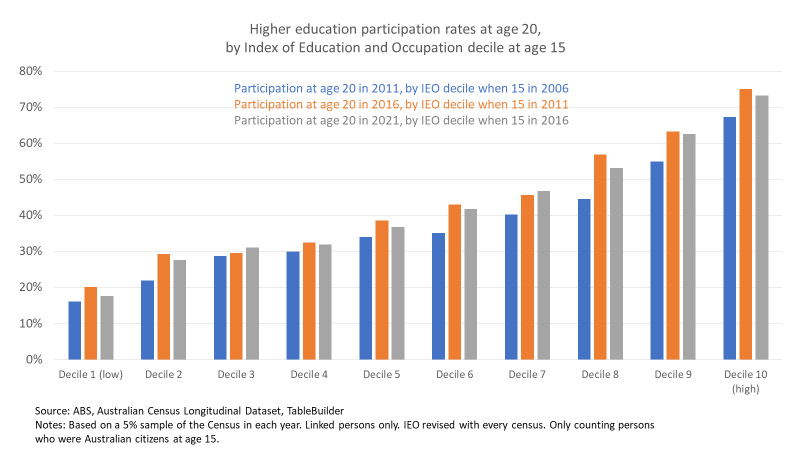
One issue with measuring trends in low SES enrolments is correctly identifying low SES students. In higher education statistics a person is low SES if from an area in the lowest 25% by the ABS Index of Education and Occupation. As charts below will show, this IEO geographic proxy shows a distinctive lowest 10% for higher education participation. Above that, however, we see modest participation and attainment increments between deciles 2-6, with differences then speeding up to a distinctive top 20%.

The participation rate similarity between deciles 2-6 makes the current low SES definition unsuitable for funding purposes, but a reasonable rough guide to overall trends. Because deciles 2-6 are sociologically similar, they probably respond in similar ways to economic, educational and policy trends affecting higher education enrolments.

In his speech, the minister referred to an enrolment share metric, low SES students/all domestic students. That’s administratively convenient but analytically weak, as low SES results depend as much on movements in middle and high SES as low SES enrolments. Participation rates are better measures, low SES higher education students/low SES population.

The chart below uses census longitudinal data for school leavers, taking as their SES the IEO ranking of where they lived when they were 15 years old, to better capture the social context of their secondary school years. The orange bars show that in 2016 all deciles had increased their participation rates since 2011, facilitated by the demand driven funding system. But in 2021, shown in grey bars, the participation rate in most deciles was lower than in 2016. There may be some statistical noise. This dataset takes a 5% sample of the census and my results omit unlinked census records – meaning the ABS could not track the same person from census to census or the necessary data was missing. But other data reported in this post confirms that the overall trend is real, even if some decile results are not 100% accurate.

Read More »

A recovery in undergraduate higher education demand

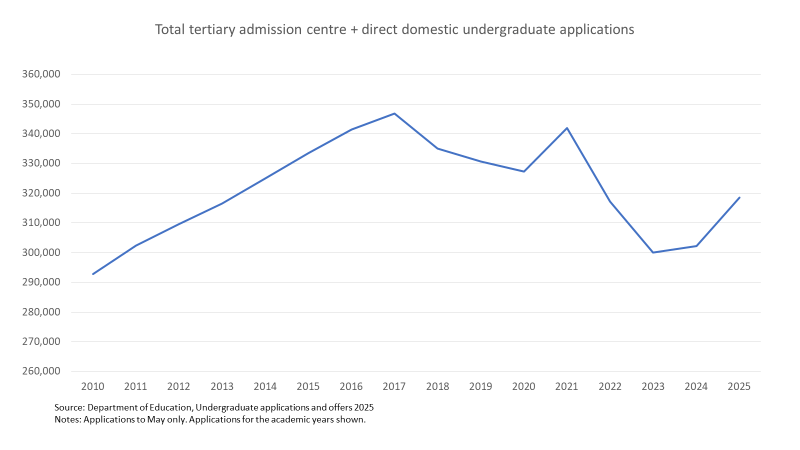
A media release from Jason Clare today reports that 2026 university applications from tertiary admissions centres, other than in Western Australia, are up 4.6% on 2025. Offers are up 2.5%. This comes after 2025 data was quietly released on the Department’s website last week. I will draw on that 2025 data to outline trends.

Overall application trends

If the 2026 TAC data is an accurate guide to application overall trends, it comes on top of a 5.4% increase between 2024 and 2025. In absolute numbers 2025 is still below the 2014 to 2021 period, but with a clear upward trend.

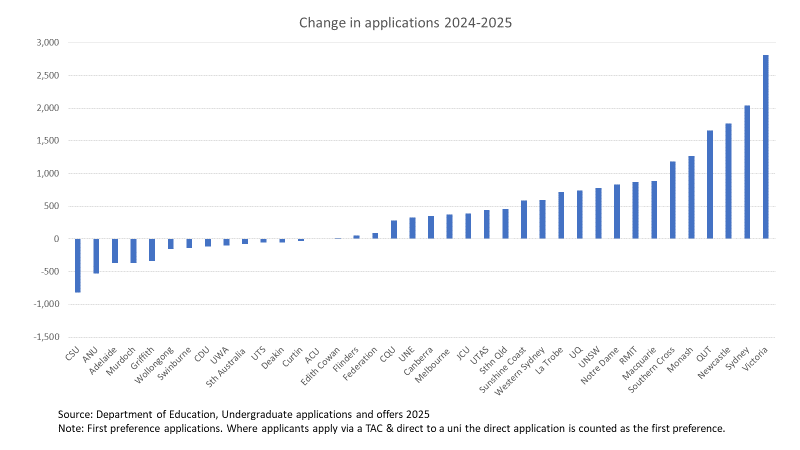
While aggregate applications are up, eight universities had fewer applications in 2025 than 2024. Other universities had major applications increases between these years, nine with double-digit percentage growth. The disconnect between these fluctuations and the proposed ‘managed growth’ enrolment system will be a policy problem of the coming years, presuming the required legislation passes (which of course I hope it doesn’t).

Read More »

The 2026 funding agreements, Part 2: Sorting out the medical student policy mess

Last year the Parliament passed legislation making Commonwealth supported places demand driven for Indigenous students enrolled in medical courses. It sounded good, we need more Indigenous doctors. But as I pointed out, the policy as legislated risked reducing non-Indigenous medical student enrolments without increasing Indigenous medical students enrolments.

The 2026 funding agreements reveal that the Department of Education has been quite inventive in finding a workaround to prevent this perverse outcome. The price, however, is yet more complexity in higher education policy.

The problem

A demand driven funding policy for Indigenous medical students assumes that fixed total funding holds Indigenous enrolments down. Student places are indeed unusually restricted in medicine. Medicine is the only ‘designated’ course, meaning that the government sets a specific number of student places. While designation does not prohibit over-enrolments (i.e. student contribution only places), medicine also has a completions cap. A standard funding agreement clause specifies that a university must not change its medical enrolments in ways that will change annual completions from the capped level.

While medical student numbers are restricted it is not clear that this prevents increased Indigenous enrolments. As I argued in my original post, universities already try hard to recruit Indigenous medical students, with special entry schemes and quotas in some cases. On the available data (below) these schemes are delivering Indigenous enrolments, a source of pride for the medical deans association. 3% of domestic medical students are Indigenous, compared to 2.3% of the overall domestic student population.

The main obstacle to further enrolment increases is unlikely to be funding. It is finding potential students who are not being set up to fail.

Read More »

Higher education participation rates at age 19 – a migration data update

For many years I have published estimates of the domestic higher education participation rate at age 19. That age was chosen as it is the modal age of domestic higher education students.

To calculate a participation rate we need a count of domestic higher education students (Australian or NZ citizen, permanent resident) and a count of the ‘domestic’ population, that is all Australian or NZ citizens and permanent residents. There are significant issues with calculating both numbers – explained in this post from last year.

One of these issues is that the ABS population figures are inflated by temporary migrants. They need to be removed from the count to get a ‘domestic’ population figure. The ABS does not provide a temporary visa/domestic breakdown. As a workaround, my participation time series deducts international 19 year old higher education students from the ABS 19 year old population estimate.

A new methodology

This onshore higher education international students aged 19 correction, however, has several problems: a) the higher education enrolment data does not cover all higher education providers; b) vocational education students are not included; and c) other temporary visa holders in Australia are not included.

These omissions should lead to an under-estimate of the temporary visa population and, after their deduction, an over-estimate of the ‘domestic’ population.

To get a more accurate temporary population figure, I asked the Department of Home Affairs for data on 19 year old temporary visa holders in Australia on 30/06/2024, the date of the ABS population estimate. Some of these visa holders may not satisfy the population count rule – that the person is or will be in Australia for at least 12 months in a 16 month period. However, people with temporary visas who satisfy the 12/16 rule but who were temporarily absent from Australia on 30/06/2024 are omitted from the count.

Read More »

The last university over-enrolment crackdown – some possible lessons

As announced last year, the government plans to crack down on so-called ‘over-enrolments’ – enrolling additional students on a student-contribution only basis once all a university’s Commonwealth Grant Scheme allocation has been used.

When a proposed new funding system is in place, from 2027, student contribution-only places will only be possible in a buffer zone above a university’s Australian Tertiary Education Commission allocation. 2% and 5% buffers have both been suggested. Currently over-enrolled universities will receive some additional funding to bring over-enrolments within their official allocation of places. However, this will not in all cases reduce over-enrolments to the permitted range. Significantly over-enrolled universities need to moderate student intakes in 2026 to bring their medium-term enrolments down.

Not many current Department of Education staff were there the last time a minister thought reducing over-enrolments might be a good idea. The story is worth telling.

Brendan Nelson and over-enrolment

From November 2001 to January 2006 the education minister was Brendan Nelson, a Liberal. Nelson was worried about the quality implications of significant over-enrolments. The first reference I can find to Nelson’s concern is in a media release from December 2001, a month into his term.

Read More »