Australian higher education policy uses a geographic proxy to measure socioeconomic status. People living in the lowest 25% of areas by the ABS Index of Education and Occupation are deemed ‘low SES’.
The IEO is one of four SES measures devised by the ABS using census results. The other three are the Index of Relative Socio-economic Disadvantage (IRSD), the Index of Relative Socio-economic Advantage and Disadvantage (IRSAD), and the Index of Economic Resources (IER).
During the Senate inquiry into the new funding legislation Greens Senator Mehreen Faruqi, drawing on the University of Sydney’s submission which said it used IRSAD for awarding scholarships, asked witnesses about possible use of IRSAD instead. Senator David Pocock also asked about SES indicators for the ACT, which has few low SES students on the official definition.
I was one of several people to receive a written question on notice on equity definitions. This post draws on my response.
Predicting educational disadvantage
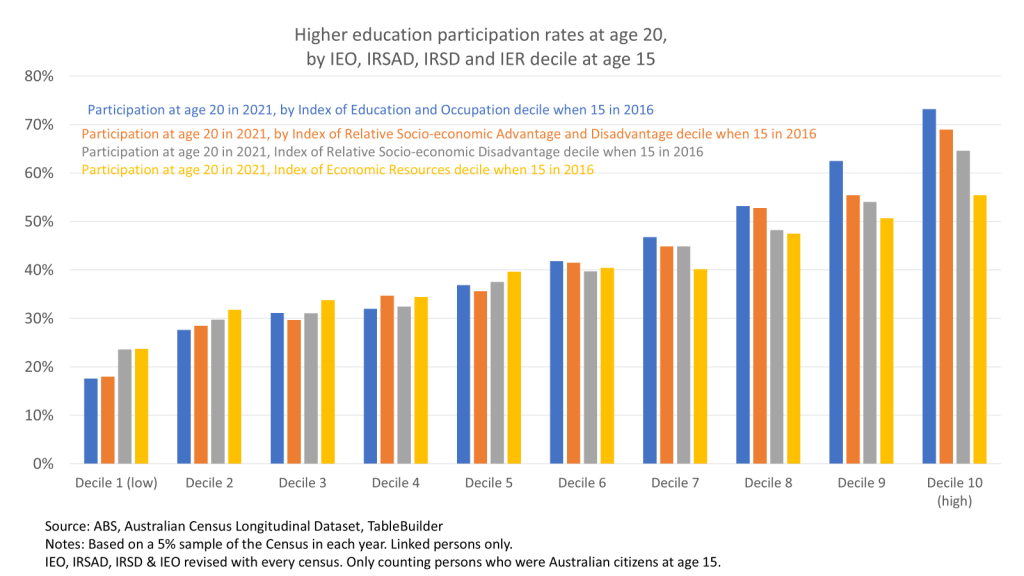
The chart below shows 2021 educational participation rates at age 20 by the four ABS SES indicators. Like the higher education version it uses SA1 areas, which on average contain about 400 people. I used census longitudinal data to capture SES when these students were aged 15 in 2016. This is a more reliable indicator of their formative years than current location, which could reflect a move closer to a university. A weakness of the funding bill currently in the Parliament is that its SES proxy is the student’s current address.
As a predictor of educational participation the IEO is the most powerful of the four. Parental education and occupation indicators show the largest high-low gaps. Young adults in the top decile are 4.2 times as likely to be at university than young adults in the lowest decile. The Index of Economic Resources is the least predictive, with top decile residents 2.3 times as likely to be at university as the lowest decile.
For outreach programs I can see merit in the IEO, to counteract absent university role models and possibly low parental expectations of higher education.
Getting students through university
But once a person is at university I am less convinced that the IEO is the best indicator. An enrolled IEO low SES person has already defied the prediction of ‘cultural’ indicators in the IEO. ‘Low SES’ students may need additional academic supports, but for enrolled students universities already have better measures of educational disadvantage, such as school or university academic results, than what they can infer from a student’s neighbours at the last Census.
In 2010s Grattan Institute analysis of attrition we used IRSD, for low SES, as the variables used to calculate it include potential practical obstacles to completion, such as low income, limited family support, and accommodation not conducive to study. The indicators of ‘advantage’ in IRSAD aren’t helpful for this purpose, making IRSD the better of the two.
The main argument I can see against this is that only some university ‘low SES’ interventions, such as scholarships, directly deal with these obstacles.
University recruitment of ‘low SES’ students
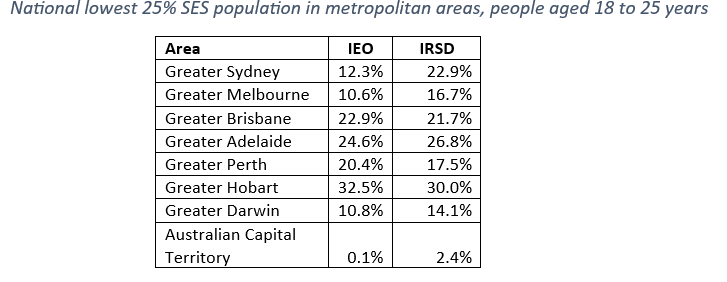
Another issue with the IEO is that the major cities, compared to other parts of Australia, produce more graduates from their local populations and attract graduates for professional occupations from other parts of Australia and overseas. These factors push up their underlying IEO scores, resulting in fewer ‘low SES’ regions within their metropolitan areas. This limits the potential population of official ‘low SES’ students, despite many areas of disadvantage in big cities.
The table below shows that Sydney and Melbourne have official low SES populations, in the main undergraduate demographic, that are less than half the parity target of 25%. Recruiting a high proportion of the official low SES population in their greater metropolitan areas would lead to a good participation rate (the chart above) but still a low university enrolment share, which is how SES ‘performance’ is measured in higher education.
Use of IRSD would widen the potential pool of students significantly, although Brisbane, Perth, and Hobart universities would be a little worse off.
Lowest 25% as another problem
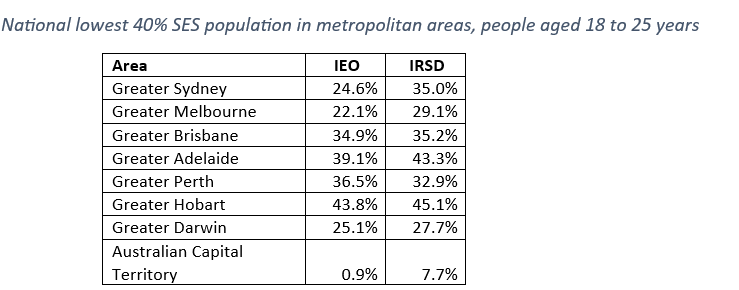
I have complained for a long time about the arbitrary nature of the lowest 25%. There is a distinct lowest 10% in all the ABS SES metrics, but no clear dividing line around 25%. My data source presents in deciles, but decile 3, which is half ‘low SES’ students, has very similar participation rates to decile 4.
Under the current policy, half of the third decile students will attract a needs-based funding loading of $1,535 while the other half and the fourth decile students get the same funding as the tenth decile students, i.e. $0 extra. Universities with enrolment catchments between the 26th and 40th percentiles are under-funded relative to the probable needs of their student populations.
Use of lowest 40% by IRSD of low SES would still leave some metropolitan areas short of potential ‘low SES’ students but would be much better than current measures. When ATEC in its compacts sets low SES enrolment targets it would not be, as it probably is now, demanding that universities enrol people who do not exist in any nearby place.
Allocating funding to students
Clearly no ABS geographic proxy is a direct individual measure of low SES. But a SES measure that misclassifies individuals is not necessarily a major problem if funding at the institutional level is proportional to likely student needs. Universities can then make decisions about individuals based on criteria that they find helpful in identifying need.
Yet the government’s funding bill tries to prevent this flexibility, by stipulating that equity needs-based funding must be spent on activities that are ‘primarily for the purposes of supporting eligible equity students’: proposed section 39-70(2).
While previous equity programs had similar requirements, my conversations with equity practitioners suggest that strictly applying these rules can be impractical and unethical. A student with evident needs does not have their address checked and given a ‘computer says no’ response if they live outside a lowest 25% area.
A better approach may be to redraft section 39-70(2) to say that needs-based funding must be used ‘primarily for the purposes of supporting students who, on the provider’s reasonable view, have experienced educational or social disadvantage’.
Universities would still need to report on how they use their grant, justifying their decisions on which students to support.
Conclusion
If policymakers only needed a rough guide to whether low SES enrolments were going up or down then the IEO lowest 25%, while imperfect, would probably be sufficient. The sociological similarities between deciles two to four would probably tend to move their higher education participation rates in similar ways due to experiencing common social, educational and economic trends.
But the lowest 25% by the IEO is seriously deficient as a funding basis for either universities or students within universities.
The funding bill gives the minister the power to redefine ‘low SES’. But I am not optimistic. The current definition has been criticised many times, including by reports the government itself commissioned. All of this work has hit bureaucratic and political inertia. As my proposals would make many more students ‘low SES’ the increased funding this bill entrenches gives government a greater financial reason to maintain the status quo, no matter how unsatisfactory this is.

