The government’s HELP legislation, cutting student debts by 20% and introducing a new repayment system, was introduced into Parliament yesterday. While I have criticisms of the 20% cut, it will be implemented and once done cannot be reversed. The changes to the repayment system will pass now but can, and probably should, be changed at a later date.
In this post I briefly explain how the repayment system will change and then discuss the choice of the first threshold.
The current and proposed student debt repayment systems
Under the current system, repayments start at an annual income of $56,156, at which point student debtors repay 1% of their total income. From there the percentage of income repaid increases incrementally to reach 10% of income at $164,712.
Under the new system repayments start at when income exceeds $67,000. At this point a marginal rate of 15% of income above $67,000 applies up to $124,999, where a marginal rate of 17% applies for income of $125,000 or more. Unexpectedly the bill restores part of the old system with an annual repayment cap of 10% of total income. This avoids some high income earners paying more than now.
The new thresholds will be indexed to growth in average weekly earnings. The current thresholds are indexed to CPI.
The logic of the first threshold
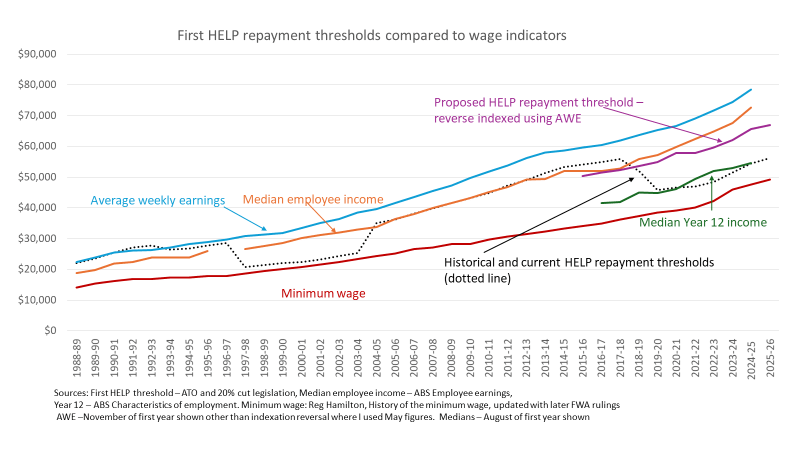
As the chart below shows, in the black dotted line, the first repayment threshold has changed over time. The long-term policy/political tension is between the idea that graduates should enjoy some financial advantage before repaying their student debt and the idea that student debt should be repaid except in cases of financial hardship. The policy pendulum is currently shifting from the latter to the former.
The introduction of HECS
The early politics of HECS shaped future debates. The 1988 Wran report, which recommended HECS with an income contingent repayment system, suggested that the first threshold be ‘around the annual average earnings of all employees’, which is roughly where it was at the start.
While not clearly articulated in the Wran report, the average weekly earnings benchmark reflected the logic of their argument for reintroducing student charges after a period of free higher education. The report made much of the private financial benefits of higher education, noting that ‘graduates with no work experience earn around the level of average weekly earnings of all Australian workers’. If students should pay for their education because they earned more than other workers, as the Wran report claimed, it made sense that they only pay if they in fact received this benefit.
This was a bold argument. While the beneficiaries of many other government programs faced tough means tests, students could socialise the risk that their higher education did not pay off financially. But avoiding such anomalies was less important than getting HECS past sceptical Labor Party members, many of whom believed that free education had been more successful in widening access to higher education than was in fact the case.
The first Howard government cuts the first threshold
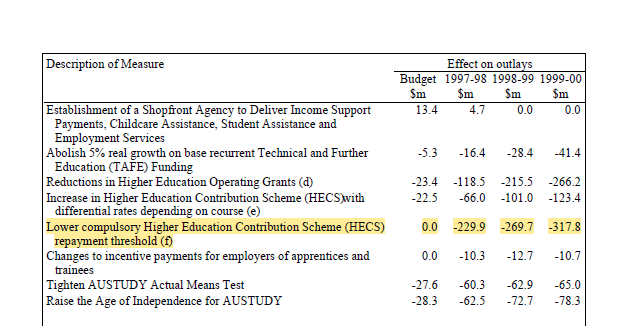
From 1997-98 the Howard government cut the first repayment threshold to just above the full-time minimum wage, although no wage benchmark was referenced. This returned risk to the student.
The Howard government’s policy was motivated by its Budget ‘black hole’ fiscal repair program. One interesting point in a recent book I read by Ben Spies-Butcher was about how ICLs are treated in the Budget papers. In the mid-1990s, when budgets were more focused on what we now call ‘headline cash’ (i.e. actual cash), the consequences of the threshold change were in the budget papers, as a negative effect on outlays (i.e., the government received more revenue).
Now the actual major cash flows for ICLs barely appear in the main budget metric, ‘underlying cash’. As a result the ‘financial impact statement’ with the 20% cut/repayment reform legislation is analytically worthless. We only have a serious attempt at costing because the Parliamentary Budget Office costed the Dutton Opposition’s decision not to proceed with Labor’s HELP changes.
The third Howard government increases the threshold
With its Budget black hole crisis over, the Howard government’s 2003-04 Budget increased the first threshold again, to start in 2004-05. Senate negotiations around a broader higher education reform package saw it increased further on what the government originally planned.
As in 1996 the policy announcement did not relate the new threshold to any wage benchmark, though as the first chart shows it was in practice very similar to median income for all employees. At least impliedly, policy had returned to an idea that graduates should pay when a financial advantage is received, but not otherwise.
The Turnbull and Morrison changes
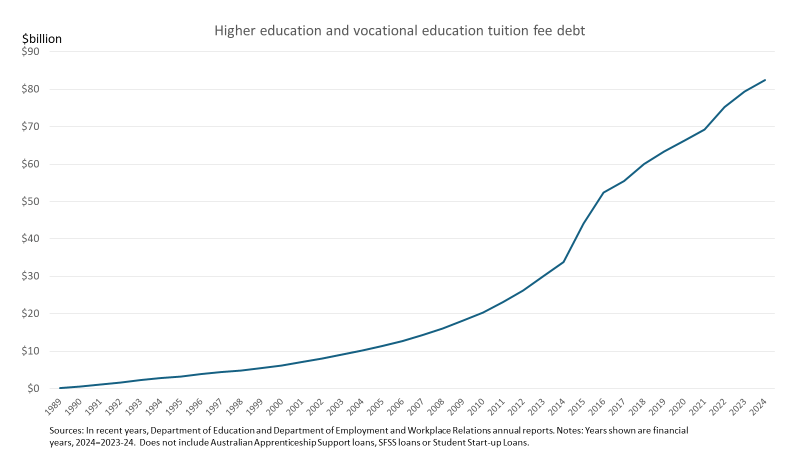
After the 2004-05 threshold change repayment policy was quiet for a decade. But higher education policy was not. Increased student contributions from 2005, the new FEE-HELP loan scheme introduced in 2005, VET FEE-HELP later in the decade, and the demand driven funding system boom in HECS-HELP lending triggered a major escalation in student debt.
In the mid-2010s, when I worked for the Grattan Institute, I became concerned about this increase, mostly from a public finance perspective. We proposed various measures to improve HELP’s finances, including lowering the first repayment threshold. The basic argument was that the threshold should protect against financial hardship but not guarantee a financial benefit. The logic was to better align HELP with the rest of the welfare state rather than put university students in a special category.
While two lower first thresholds were implemented in the late 2010s, design flaws in the overall new repayment system undermined its capacity to significantly increase repayments relative to the prior system.
A shift from AWE to CPI threshold indexation, another Grattan recommendation to increase repayments, was also implemented. However this backfired in the post-COVID inflation period. The issue here was not just the first threshold but that all 18 thresholds were indexed, often shifting debtors down a repayment bracket.
Although not a comparison made at the time, the first chart shows that the current first threshold roughly tracks the median income of someone whose highest qualification is Year 12. Year 12 income is the default comparison point of most estimates of the ‘graduate premium’ in salaries. A Year 12 threshold provides graduates with some protection from outcomes that are worse than if they never went to university, but does not guarantee better outcomes.
The Universities Accord/Clare first threshold
When the Universities Accord final report recommended increasing the first threshold they directly referred to its history, although with incorrect detail (the average income they refer to looks like full-time AWE, which it never was; there has been no ‘steady decreases’ in the first threshold):
The minimum repayment threshold above which those with HELP loans are required to make
repayments is currently around 50% of the average income level – the result of steady decreases in the minimum repayment threshold over time. It was originally envisaged that those with HELP loans would only be required to repay once they reached around an average income level.
The government’s November 2024 announcement of the new threshold created a new benchmark:
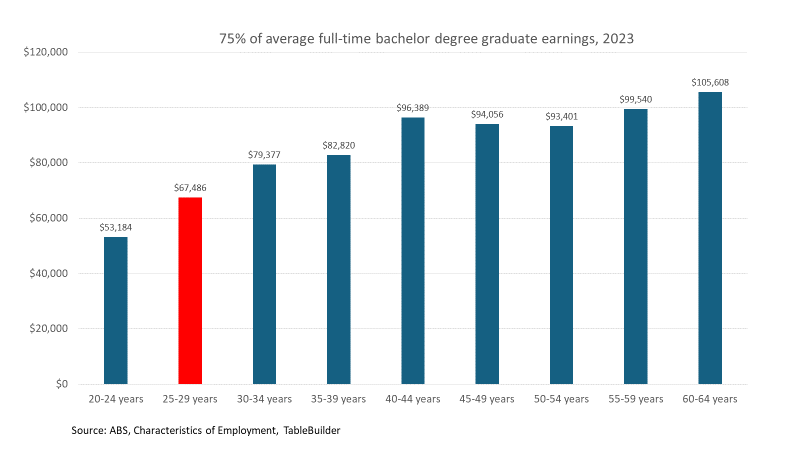
The new minimum repayment threshold of $67,000 represents around 75% of average full-time earnings of a recent higher education graduate as measured by the Australian Bureau of Statistics.
This is not a number the ABS routinely reports – and raises the question of why the government ignored the graduate outcomes surveys the Department of Education funds – but I think they might have based the $67,000 on the average income for people aged 25 to 29 years in the 2023 ABS Characteristics of Employment survey, which was the latest available in November 2024.
The $67,000 threshold seems like a compromise of some sort between a link with graduate advantage and trying to recover money lent. As can be seen in the first chart above, $67,000 is well above median Year 12 earnings but below either median employee earnings or average weekly earnings.
A subsequent post will look at other implications of the $67,000 threshold.
