Why is demand for mature-age undergraduate education shrinking?

I have an article in The Conversation this morning on why demand for undergraduate higher education has been weak in recent years. I looked at school leavers in this July 2025 post. This post expands on the issue of mature age demand.
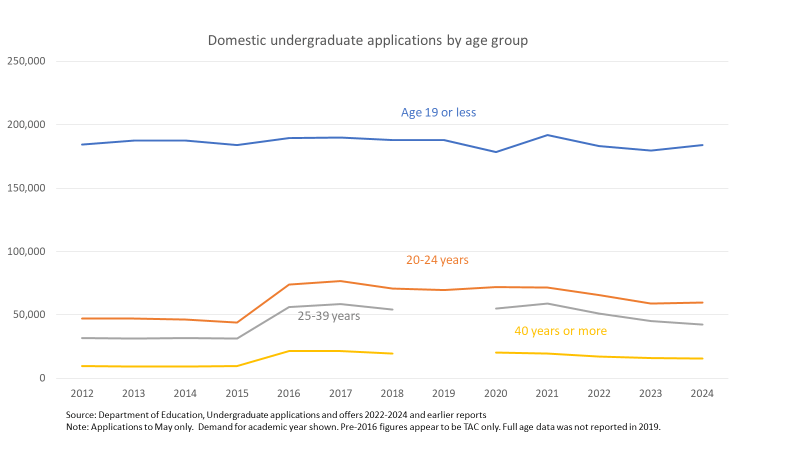
Applications

Demand from school leavers is soft but in 2024 was down only 3% on its 2017 peak. But demand from 20-24 year olds is down over the same period by 22% and for the 25 years + age group it is down by 27%. In absolute numbers, demand from school leavers fell by 6,057 applications compared to 44,545 fewer applications from mature age applicants.

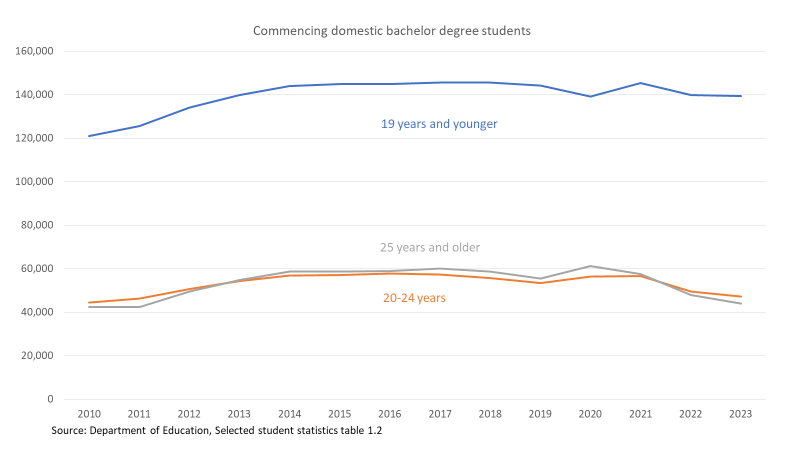
Commencing enrolments

For commencing bachelor degree enrolments 2017 to 2023, unsurprisingly given the applications data, demand has also fallen by the most in the older demographics.

School leaver commencing enrolments are down 4% while the figures are 18% for the 20-24 years group and 27% for the 25+ group. Overall 6,216 fewer school leavers but 26,276 fewer mature age students.

Counter-cyclical enrolment patterns

An applications/enrolment spike in the COVID lockdown years provided evidence for one side of the counter-cyclical theory of enrolments – that more people study when jobs are hard to find. Weak labour markets reduce the ‘opportunity cost’ of education, such as forgone work and wages.

Conversely strong labour markets increase the opportunity cost of study. On average this is especially so for older people, due to their wage premium from previous labour market experience. With a strong labour market since 2022 economic theory predicts that, all other things being equal, enrolments will decline.

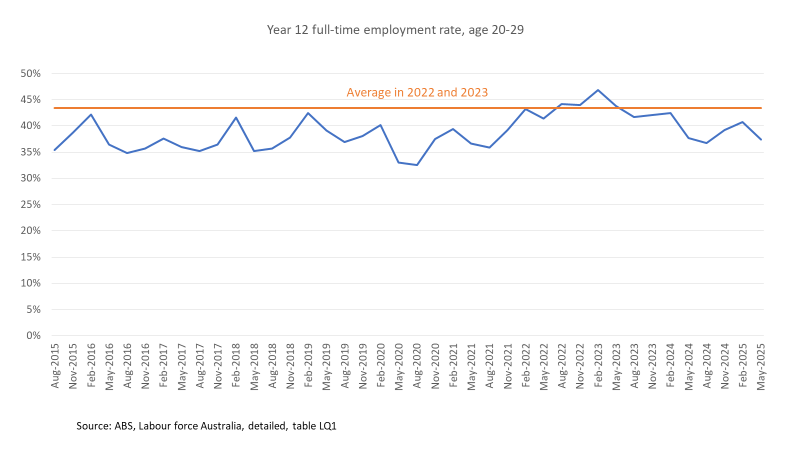
In the chart below we can see full-time employment for 20-29 year olds who have completed Year 12 but have no degree was at its lowest level in 2020, in the 2015-2025 period for which we have education levels in the labour force survey. In the initial post-COVID lockdown period, however, we can see that it was much easier than it had been in the 2010s to get a full-time job with a Year 12 qualification only.

The 2020s has provided evidence in favour of the counter-cyclical theory of higher education enrolments.

But does a cyclical theory of enrolments fully explain declining mature-age commencements?

Read More »

University under-enrolment in the COVID and after years

Recently the Department of Education published 2021-2022 data on payments under the Higher Education Continuity Guarantee, a 2021-23 Coalition program to compensate universities for under-enrolments. It has previously released data on a predecessor program, the 2020 Higher Education Relief Program.

It shows that over the 2020 to 2022 period under-enrolments cost the Commonwealth nearly $550 million. On my estimates the sector under-enrolled by approximately 47,000 places. Eight universities were under-enrolled in each of 2020, 2021 and 2022. Only four universities received nothing under the HECG or HERP, showing that enrolment shortfalls were widespread across the sector.

What is under-enrolment?

Under the Higher Education Support Act 2003 universities get paid their maximum basic grant amount (MBGA) – see my funding agreement posts for more detail on this – or the value of their Commonwealth supported places delivered (on a relevant Commonwealth contribution * EFTSL basis), whichever is lower.

During the COVID period the Coalition decided that it would let universities keep their MBGA even if they had not enrolled enough students to justify it. This was called the Higher Education Relief Program in 2020 and the Higher Education Continuity Guarantee 2021-2023. The purpose was to provide stability for universities during COVID and post-COVID enrolment turbulence.

There is a 2024-2025 program called the HECG, but it is a redirect of money to equity programs and has nothing to do with the original purpose of the HECG.

Read More »

Has funding for Commonwealth supported students been cut?

With universities back job shedding, academics and their unions are looking for someone to blame. University leaders and consultants are being attacked for poor decisions. The government also gets criticised. UTS history professor Anna Clark says that over the last twenty years ‘we have seen gradual, steady decline in government investment across the sector’. In his recent lament Broken Universities, Graeme Turner says that there has been a ‘steady decline in the levels of funding per student’.

Five years ago, early in the COVID crisis, I wrote a post about government ‘cuts’. This post is an update.

Funding for Commonwealth supported students

As my earlier post noted, time series data is not straightforward. The chart below focuses on the major student funding programs, in today’s terms the Commonwealth Grant Scheme (CGS), HECS-HELP, and upfront student contributions. These funding sources have always had a link to the number of full-time equivalent Commonwealth supported students, although historically the money they delivered supported research as well as teaching expenditure.

Around these core funding sources other schemes serve the same purpose (e.g. transition funding) or similar purposes (e.g. NPILF). The chart below includes the Job-ready Graduates (JRG) transition funding and but excludes NPILF. It includes money paid from the Higher Education Continuity Guarantee, a COVID measure still in place for universities that ‘under-enrol’ that would normally face a CGS penalty. From 2021-2024 the time series excludes the enabling course loading that was previously in the CGS but moved to IRLSAF. But this funding is back in the CGS in 2025 due to the FEE-FREE Uni Ready places. The regional loading remains out from 2021 as it is still in IRLSAF and will join needs-based funding next year.

Overall my time series goes for simplicity over a full count of expenditure on student-related programs. In the time series, one big structural change should be noted, which is research student funding moving to a separate program from 2001, which caused a significant but artificial year-on-year decline.

Trends in total funding

Focusing on recent times, in nominal dollar terms total CGS funding dipped between 2021 and 2022, which was mostly short-term COVID places coming out of the system. HECS-HELP lending fell between 2020 and 2021, driven by the strange decision to pass on reduced JRG student contribution rates to all current students but to grandfather increased student contribution rates, so that only 2021 and later commencing students pay them. HECS-HELP lending fell again in 2022, with lower student numbers also affecting revenue from a university perspective.

Read More »

Gender-based violence legislation, Part 3: Reporting and penalties for higher education providers

The first post in this series outlined the meaning of gender-based violence and processes that apply to all higher education staff and students. The second post looked at processes when a complaint of gender-based violence is made.

Legislative references, unless otherwise specified, are to the Universities Accord (National Higher Education Code to Prevent and Respond to Gender‑based Violence) Bill 2025. The draft code is here; it uses the language of ‘standards’ but I will refer to code ‘sections’ when noting a specific rule or requirement.

Update 20/10/2025: The enacted legislation is here. The enacted code is here.

Reporting

The code comes with very extensive reporting requirements. All the different things providers must report on run for four pages in the code: standard 6, pp. 17-20.

The code stresses the role of the data collected on programs to reduce gender-based violence: code section 6.1.

The Secretary can disclose information received as part of this reporting: sections 43 and 44.

The Secretary must produce an annual report to be included in the Department’s annual report (which is usually tabled in Parliament in October): section 47.

Given the Department of Education’s chronic failure to release higher education data in a timely way a statutory requirement to publish an annual report is good.

While the Department’s annual report operates on a financial year basis it would be helpful to produce the data on a calendar year basis as well, to reflect the operating cycle of universities.

Read More »

Gender-based violence legislation: Part 2, Processes for victims and perpetrators

My first post on the higher education gender-based violence bill and its draft code looked at how gender-based violence is defined and the broad obligations placed on higher education providers and their staff and students.

This post examines procedures for student victims of gender-based violence and for the accused perpetrators. The rules also apply to staff, but as there are existing laws on these matters for workplaces I will focus on students. There is a 2024 summary of university policies and practices on responding to sexual violence, but I have not attempted to compare them to the code.

The code includes reasonable measures to support student victims and, to a lesser extent, accused respondents. I am not convinced, however, that the latter will face a fair process in more serious cases if universities rely on the code alone to guide their policies.

Update 20/10/2025: The enacted legislation is here. The enacted code is here.

Student victims/disclosers

A common criticism of universities has been inadequate responses to student complaints regarding sexual misconduct. In a 2021 student survey on sexual harassment and assault most victims did not report their experience to the university, but of those who did over 40% were dissatisfied. The code includes an extensive list of things that providers must do in these cases: code section 4 (all legal references unless otherwise stated are to the draft code).

These required provider actions include implementing measures to ensure the safety of the discloser, prioritising urgent access to support services, minimising how often the discloser must repeat their story, providing translation and interpretation services where necessary, implementing academic adjustments, and where necessary discussing the investigation and disciplinary processes: code section 4.6.

The discloser must have the opportunity for a support person to be present: code section 5.11.

Read More »

Gender-based violence legislation: Part 1, Definitions and requirements for all higher education providers, staff and students

Legislation on ‘gender-based violence’ in higher education is back in Parliament. Its principal purpose is to provide a legal foundation for a National Higher Education Code to Prevent and Respond to Gender-based Violence. This will be a legislative instrument made after the legislation is passed, but the minister has released its expected contents.

The code is scheduled to start on 1 January 2026 for universities and 1 January 2027 for other providers.

This post looks at the definition of gender-based violence, extension of the policy beyond higher education providers, and policies that will affect all staff and students. A second post looks at procedures for victims and perpetrators of sexual harassment or assault. A third post looks at reporting and penalties for higher education providers (apologies, but this is all much briefer than the 75-page original; 45 pages in the bill and 30 in the code).

Update 20/10/2025: The enacted legislation is here. The enacted code is here.

What is gender-based violence?

According to the bill, ‘gender‑based violence means any form of physical or non‑physical violence, harassment, abuse or threats, based on gender, that results in, or is likely to result in, harm, coercion, control, fear or deprivation of liberty or autonomy’: section 5 (legislative references, unless otherwise specified, are to the Universities Accord (National Higher Education Code to Prevent and Respond to Gender‑based Violence) Bill 2025).

Read More »

University funding systems and what graduates see as important in a job

For a side-project I’ve recently engaged with the subject of whether higher education funding systems shape the educational and career choices of students and graduates.

On one theory, where fees are charged students focus more on courses and jobs with high pay. Courses that satisfy intrinsic interests but do not offer good salary prospects would be less popular in countries with fees or after fee increases. Focus-group research on the views of students in European countries provides some support for this view (I have not cross-checked this against enrolments).

Under fee systems, depending on loan arrangements, taking courses with good job prospects may be necessary to reduce the risk of default on student debt repayments.

On another theory, also with some evidence from the European focus-group research, students in fee-paying countries may be more interested in courses that lead to personal financial rewards than courses that serve some broader public purpose. There are echoes of this argument in the local complaint that Australian higher education in the ‘neoliberal’ fee-charging era has lost sight of the ‘public good’.

I’ve discussed the role of interests in course choices before. In this post I look at the attitudes of graduates. My data source is survey evidence from the International Social Survey Programme. Unfortunately Australia only occasionally participates in these multi-nation comparative studies, but the ISSP’s 2015 work orientation questionnaire has Australian data.

What Australian graduates see as important in a job

In the ISSP respondents are asked what job attributes they personally see as important.

A job being interesting is the single-most desirable attribute of a job for Australian graduates. This is consistent with interests being the dominant factor in course choice.

The ISSP question has two other-regarding options, being useful to society and helping other people. I presume helping others is a hands-on form of being useful, such as a teacher or nurse, while a policymaker, engineer or executive can produce useful-to-society structures and systems without directly helping specific individuals.

Perhaps because being useful to society is more general it is rated above helping others, and is the third mostly highly rated attribute overall.

Only 10% of graduates rate a high income as very important, the lowest of any attribute and the overall importance of money is the second-lowest of the options given. Money is nice to have but other job attributes are more important.

Read More »

Graduate income fluctuations and HELP repayment

Last week I raised concerns about the new HELP repayment system increasing the number of HELP debtors who face very long repayment times or lifetimes of student debt.

The calculations in that post assumed that people maintained their relative income position through their careers – for example that someone who earned the median income at age 25 would still do so at age 35, 45 etc. We know, however, that relative income fluctuates. Family commitments drive movements in and out of full-time work. Careers go better or worse than expected.

Without solving the problems involved in estimating how these changes affect HELP repayments, this post outlines findings on graduate income mobility and labour force status changes.

Movements between income quintiles

The chart below uses data from a Productivity Commission report on economic mobility. It shows changes in relative income, between five economic quintiles, over a decade since degree completion. The data source is HILDA.

Quintile 5, the highest, shows strong stability. More than 80% of graduates in quintile 5 were still there or in quintile 4 a decade later. The high starting point and following stability may be due to people already doing well in their careers acquiring postgraduate qualifications.

The other quintiles all show significant movement in relative income. Upward movement is expected as we know graduate incomes increase in the years after course completion. Almost half of graduates in the lowest quintile in year one are in the top two quintiles a decade later.

Bu there is also some stability at the lower end. In the two lowest quintiles, 1 and 2, over a quarter remain in those quintiles a decade later. In quintile 3 we see a similar share falling back to quintiles 1 and 2. While some of this is career stagnation, ten years out takes into the ages when women start leaving full-time work to meet family responsibilities.

Read More »