Last week I raised concerns about the new HELP repayment system increasing the number of HELP debtors who face very long repayment times or lifetimes of student debt.
The calculations in that post assumed that people maintained their relative income position through their careers – for example that someone who earned the median income at age 25 would still do so at age 35, 45 etc. We know, however, that relative income fluctuates. Family commitments drive movements in and out of full-time work. Careers go better or worse than expected.
Without solving the problems involved in estimating how these changes affect HELP repayments, this post outlines findings on graduate income mobility and labour force status changes.
Movements between income quintiles
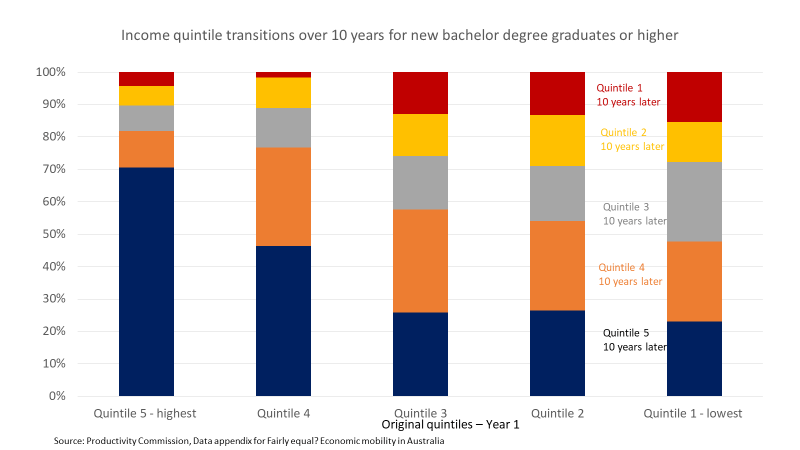
The chart below uses data from a Productivity Commission report on economic mobility. It shows changes in relative income, between five economic quintiles, over a decade since degree completion. The data source is HILDA.
Quintile 5, the highest, shows strong stability. More than 80% of graduates in quintile 5 were still there or in quintile 4 a decade later. The high starting point and following stability may be due to people already doing well in their careers acquiring postgraduate qualifications.
The other quintiles all show significant movement in relative income. Upward movement is expected as we know graduate incomes increase in the years after course completion. Almost half of graduates in the lowest quintile in year one are in the top two quintiles a decade later.
Bu there is also some stability at the lower end. In the two lowest quintiles, 1 and 2, over a quarter remain in those quintiles a decade later. In quintile 3 we see a similar share falling back to quintiles 1 and 2. While some of this is career stagnation, ten years out takes into the ages when women start leaving full-time work to meet family responsibilities.
Lifecycle changes in full-time work
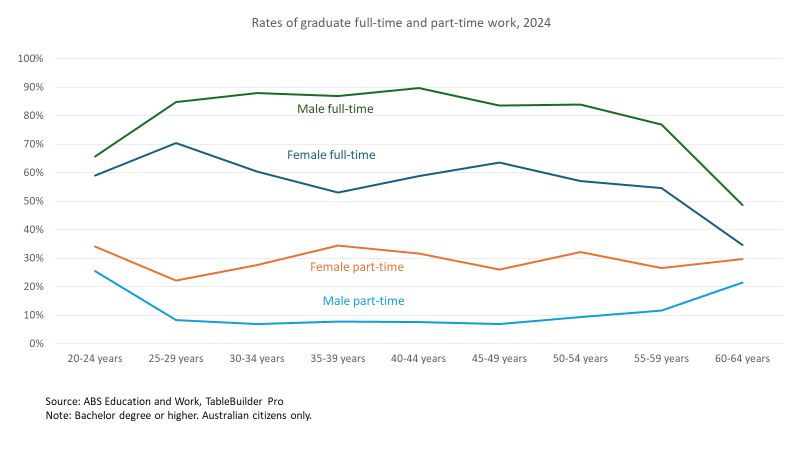
As the chart below shows, women’s full-time work rate peaks in their late 20s, dips in their 30s, then partially recovers in their 40s. Women not working at all also peaks in their 30s, at about 12% in 2024. Obviously this is the decade when women are most likely to be caring for young children.
Part-time work and the HELP repayment thresholds
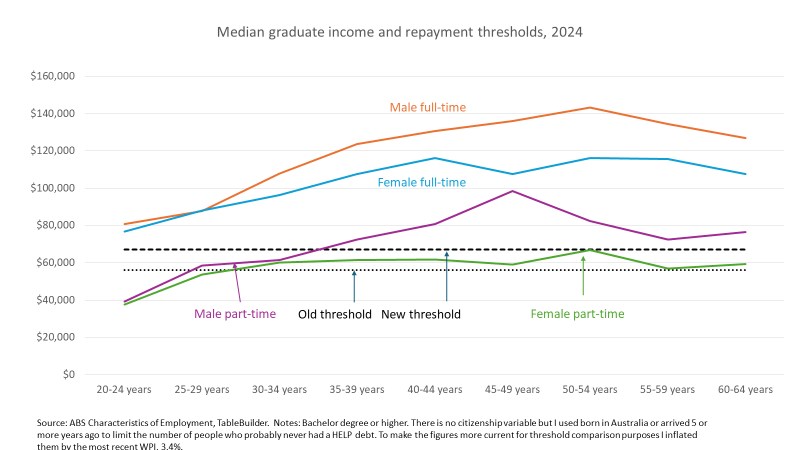
One consequence of the new first threshold of $67,000 is that most female graduates working part-time will not make any HELP repayments, as seen in the chart below. Their median income is below the threshold. This is a big change from the old repayment system, under which most female graduates working part-time made repayments. The balance between part-time and full-time work over a career is therefore more important than it was before for HELP debt balances.
5-year transitions in and out of full-time work
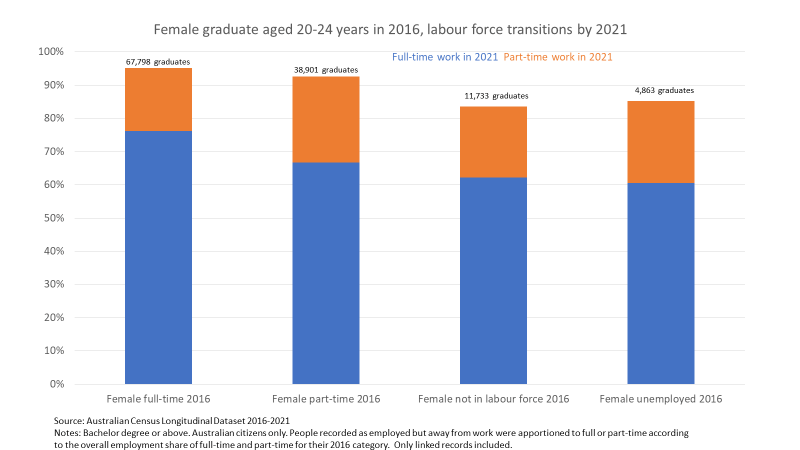
The Census longitudinal dataset allows us to follow the same person from one census to another. As expected from the chart immediately above, it shows a net transition into full-time employment for women who were aged 20-24 years in 2016 and were in the 25-29 bracket in 2021. Most women working part-time or not working in 2016 were working full-time in 2021, and so probably making HELP repayments. However, 24% of the women working full-time in 2016 were working part-time or not working in 2021, and so may have dropped out of making repayments.
The next chart looks at the 5-year transitions for women aged 25-29 in 2016 and 30-34 in 2021. Here we can see that, unlike the younger graduates, most women who were not working full-time in 2016 were also not working full-time in 2021. However significant minorities did join the full-time workforce. Although about a third of women working full-time in 2016 had moved to part-time work or were not employed in 2021, this group has high work rates overall.

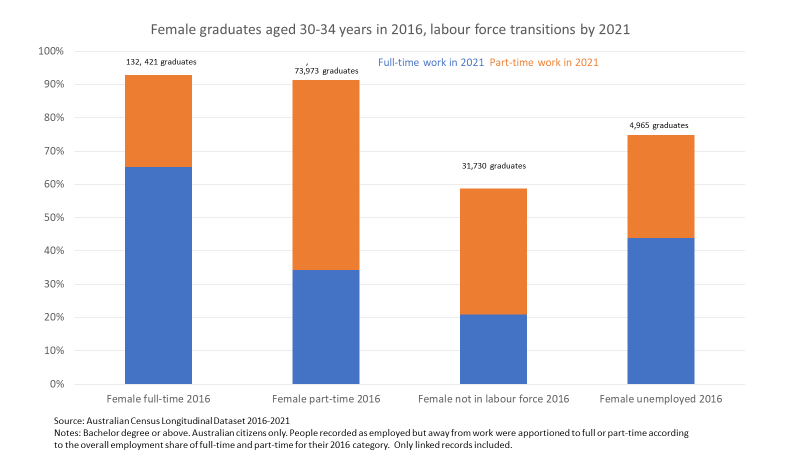
Work patterns for women aged 30-34 in 2016 and so 35-39 in 2021 again show that most who are not working full-time continue not to do so. However, we see that some women who had been working part-time or not working age 30-34 years return to full-time work in their late 30s.
Conclusion
This Census-based data is broadly consistent with the Productivity Commission income data. In the Census we can see clusters of people who persistently work full-time, and are therefore likely to be in the upper income quintiles in the PC analysis. We can see in the Census people who persistently do not work or work-part-time, and are therefore likely to be in the PC’s lower quintiles.
For understanding the implications for HELP repayment prospects, however, these are the less interesting groups. The persistent high-income groups will fully repay under the old or new repayment system, while the persistent lower-income groups will probably never fully repay under either system (although the latter group will end up with higher unpaid HELP debts under the new system, which will be officially wiped when they die).
The middle category of mostly female graduates who mix full-time work, part-time work, and time out of the labour force are the more interesting group. Due to periods of full-time work they probably will make repayments in more years than the simple model in my earlier post assumes. However, that most part-time workers make no repayments in the new system will, during periods out of the full-time labour force, exacerbate the effects of compounding HELP indexation.

As the natural experiment the former government conducted shows, students tend not to take into account the cost of their study, provided it is covered by a student loan. It is only later this worries them. So perhaps the loan repayments should be progressive. That is, low income earners would pay back less than the amount they borrowed, and high income earners pay back much more. This could be justified by saying the community is investing in the student’s future and so should receive a share of the return on that investment.
LikeLike
Versions of that idea have been proposed before, eg a graduate tax or ICLs where people repay x% of their income for x years – which could be a fortune in some cases but very little in others.
The arguments against are that these systems create new risks for universities about how much they will earn and will deter high-achievers or people with existing high comes from going to university.
LikeLike