For the first time in years higher education student income support recipient numbers have increased. On a late June count, in 2025 147,490 students were receiving payments, up 10,575 or 7.8% on the same time in 2024. All three benefit programs – Youth Allowance, Austudy and Abstudy – increased numbers but 70% of growth came from the dependent Youth Allowance category, so people aged 21 years or less subject to a parental income test.*
Trends in total numbers
Although the 2025 upward trend is noteworthy given the recent history of decline, 147,490 recipients is still lower than any year in the 2009-2022 period. It’s nearly 73,000 below the 2014 peak, despite an increase in enrolments since then.

Policy decisions influence student income support numbers, but cannot fully explain these trends. The most significant negative policy change since 2014 was the 2016 conversion of the Start-up Scholarship to a loan, effectively reducing the non-repayable grant value of student income support by $2000 a year. But a downward trend started before then. Subsequent policy changes were small positives for students without, until 2025, stopping the decline in recipient numbers.
Student income sources
Students have three main sources of income – their family, wages and social security benefits. These can be partial or full substitutes for each other. As income sources become easier or harder to get there will be movement between them – forced in some cases by parental and partner income tests. This post focuses on the role of student wage income.
Student work
The availability of jobs suited to undergraduate students – flexible hours, low requirements for qualifications or experience – affects the extent to which students can rely on wage income.
In the ABS labour force survey we see a long-term large increase in the number of working students aged 24 years or less (the spikes up are mostly summer holidays). In the early 2010s, however, we see a temporary fall in student employment that coincides with more students receiving income support. This shows a shift away from wage income and towards benefit income.

The likely choice of benefits over work is also apparent in employment rates. In 2014, the peak year for student income support, full-time student employment rates fell below 50% for the first time since the early 2000s. Tertiary student unemployment was higher in the 2010s than in the late 2000s, so some students may have applied for Youth Allowance because jobs were hard to find.
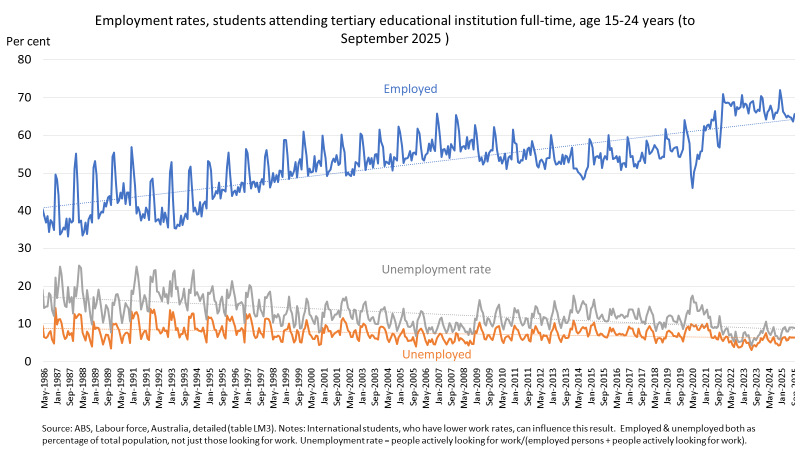
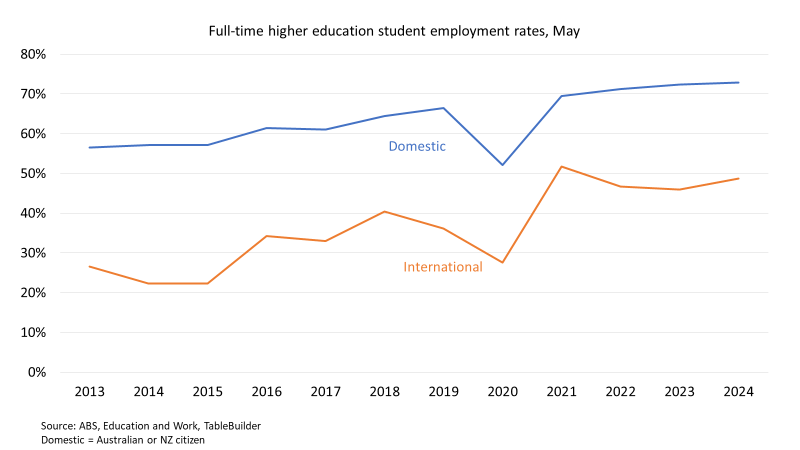
One complicating analytical factor in the 2010s is increasing international student onshore enrolments. Since 2013 the annual Education and Work survey has identified international students separately. Their lower work rates affect the overall trends. According to the chart below, 2013 and 2014 domestic employment rates were lower than subsequent years but rates for earlier years are unknown.
The increase in student employment absolute levels and rates in the late 2010s indicates a strong job market in student-friendly occupations, making work rather than benefits more feasible. With the COVID crash in jobs there is a spike in student income support recipients, supporting the idea of a partial substitute relationship between the two income sources.**
The relative financial appeal of paid work versus student income support
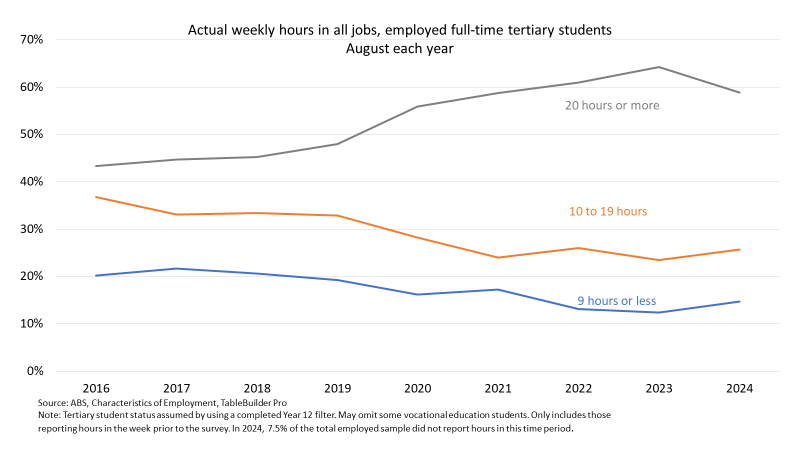
The strong student labour market of recent years hasn’t just been the number of jobs. These jobs have offered more hours as the chart below shows. This increased student income.
The chart below compares median full-time student labour market income with income from Youth Allowance for a student on the dependent rate living at home. If a student just took the base income support rate it was never, in the 2016 to 2024 time period, competitive with paid work. But student Youth Allowance recipients can also take out the Student Start-up Loan and have a relatively generous ‘income bank’ – money they can earn before they start losing their benefits. Up until 2018 being on Youth Allowance and working up to the income bank limit was financially equivalent to median paid income. Essentially students could work fewer hours for the same total income by taking Youth Allowance.
In the 2020s the median paid work income was significantly higher than the maximum income on benefits before Youth Allowance payments are reduced. At the cost of more hours at work, students would have a higher income and keep Centrelink bureaucracy out of their lives. However the premium delivered by median employment income over benefits has declined over time.
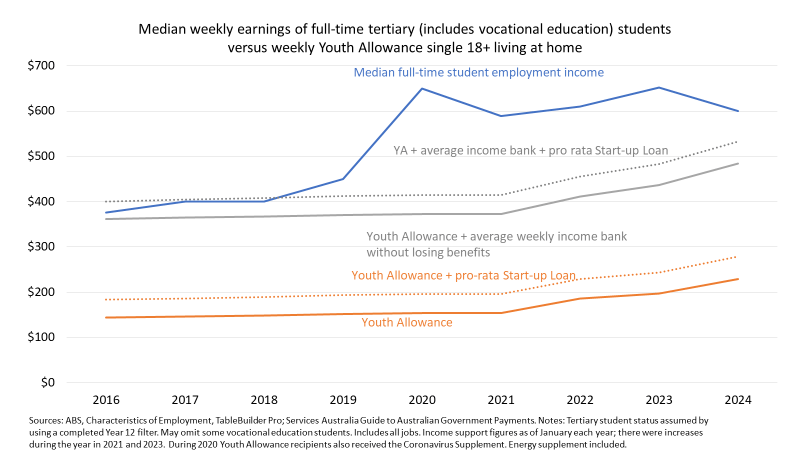
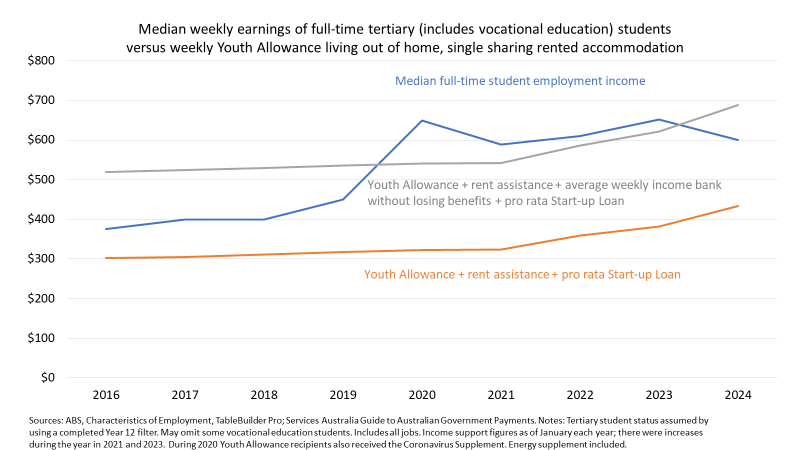
For students living out of home benefits exceeded median student paid work income in the late 2010s and again in 2024, although rent assistance probably wasn’t enough to cover rent costs. Escalating rent and other living costs may have made it increasingly difficult to survive on benefits, and so more students decided to work long hours rather than take income support.
Conclusion
Given the 21 years and under age group driving the 2025 increase in student income support I am inclined to think that it primarily reflects higher school leaver numbers, rather than the benefits versus paid work trade-off. Since April, 2025 student employment rates have been slightly below 2024 levels in the same month, but still strong by historical standards and potentially influenced by international students.
Overall, however, my hypothesis is that a strong student labour market, especially in the 2020s, made it feasible to earn much more in the labour market than income support would pay. Combined with the pressures created by increases in the cost of living, this helps explain the downward trend in the number of student income support recipients.
*This figure is calculated from data that includes students who were suspended from payments as at 27 June 2025. 6.5% of recipients were suspended.
** More parents of students on benefits themselves due to COVID job losses satisfied the parental income test and so increased student eligibility for benefits during COVID. For a while in 2020 the Coronavirus Supplement more than doubled the financial value of being on benefits.
