A media release from Jason Clare today reports that 2026 university applications from tertiary admissions centres, other than in Western Australia, are up 4.6% on 2025. Offers are up 2.5%. This comes after 2025 data was quietly released on the Department’s website last week. I will draw on that 2025 data to outline trends.
Overall application trends
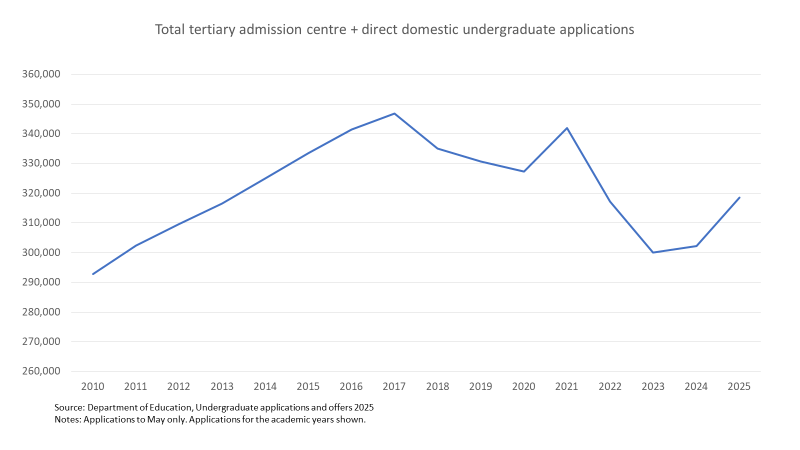
If the 2026 TAC data is an accurate guide to application overall trends, it comes on top of a 5.4% increase between 2024 and 2025. In absolute numbers 2025 is still below the 2014 to 2021 period, but with a clear upward trend.
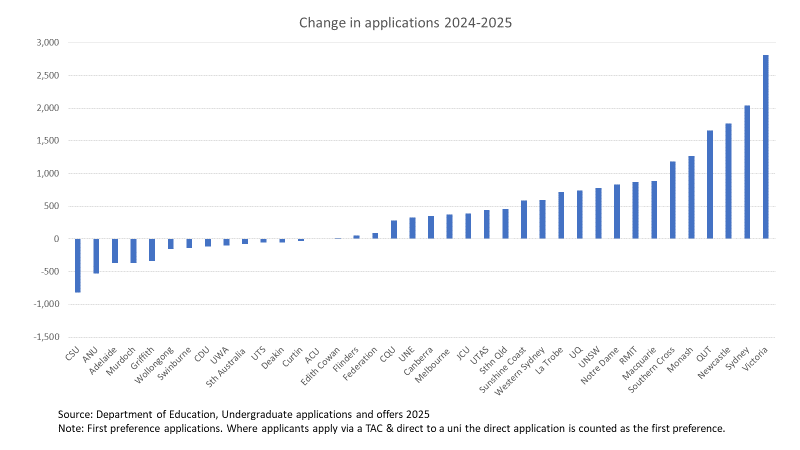
While aggregate applications are up, eight universities had fewer applications in 2025 than 2024. Other universities had major applications increases between these years, nine with double-digit percentage growth. The disconnect between these fluctuations and the proposed ‘managed growth’ enrolment system will be a policy problem of the coming years, presuming the required legislation passes (which of course I hope it doesn’t).
Field of education
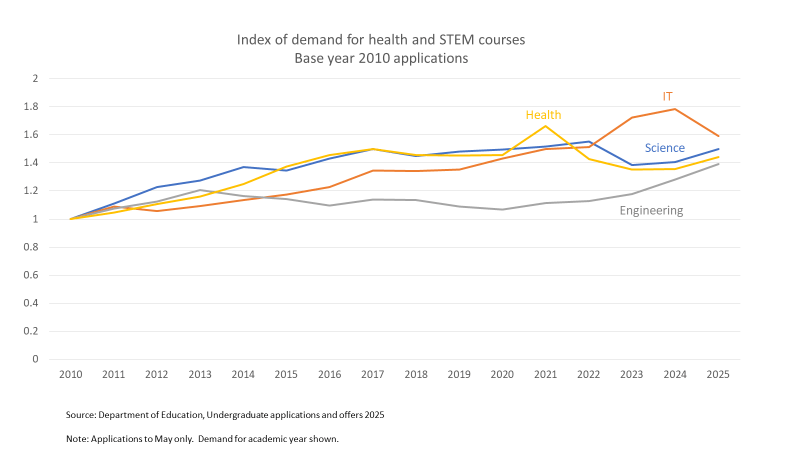
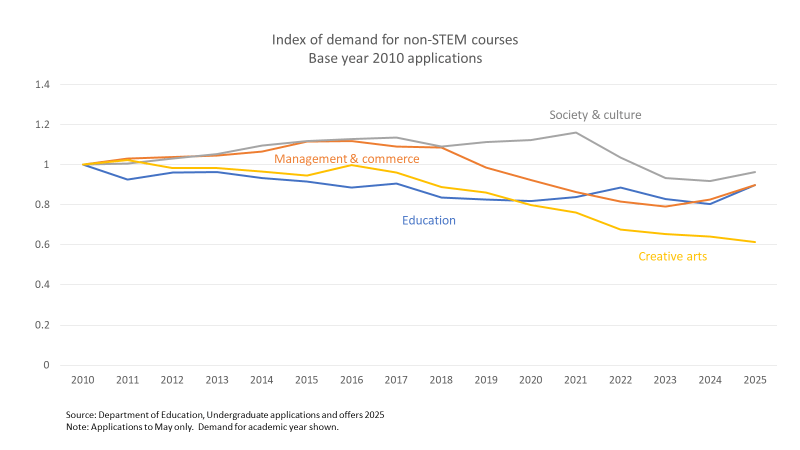
The broad field of education applications story since the mid-2010s has been the rise of STEM fields and the decline of non-STEM fields. To make the charts below easier to read I converted the varying absolute application numbers to an index with base year of 2010. The science index is 1.5, meaning that in 2025 it had 50% more applications than in 2010.
In 2025 IT came off its recent peak and several non-STEM fields enjoyed increased applications, but not enough to change the general conclusion about demand trends. All the non-STEM fields shown still had fewer applications in 2025 than in 2010.
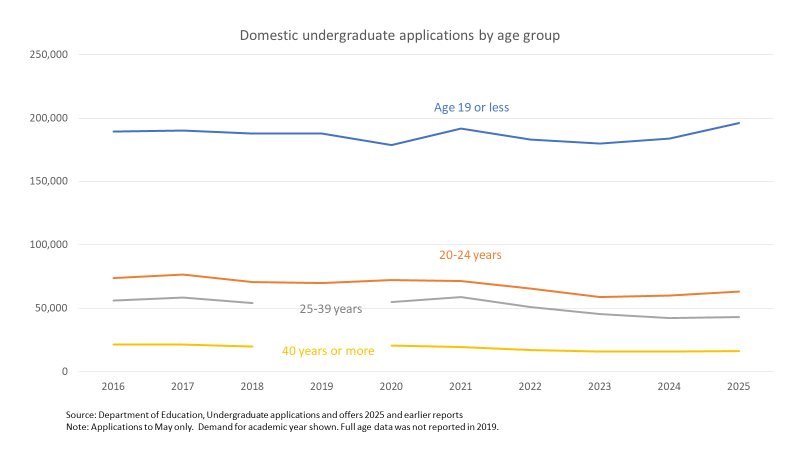
Applications by age group
All age groups shown in the chart increased applications between 2024 and 2025, but growth was concentrated in the 24 years or under groups. This is consistent with counter-cyclical and structural factors holding down mature age demand, while demographic factors boost demand in the younger age groups.
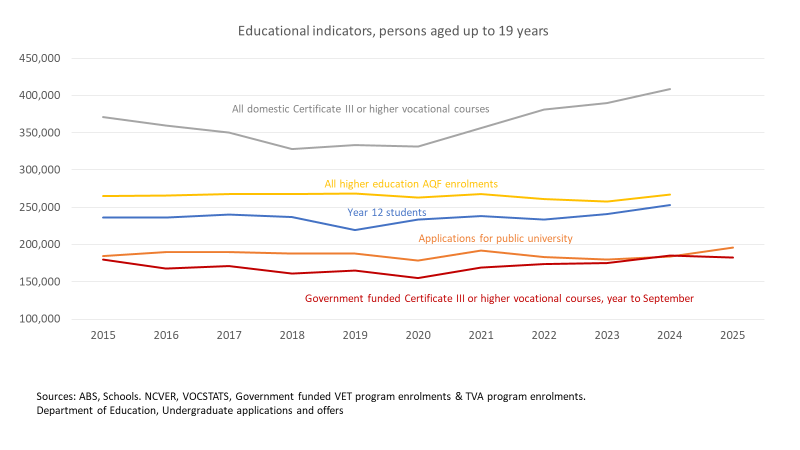
The chart below summarises data from multiple education sources to track the relevant youth education trends. The most striking trend is the strength of demand for vocational education post-COVID, although government-funded vocational courses up to September shows softening in 2025, while still being higher than any other year 2015 to 2023. Year 12 enrolments are trending up. Not all Year 12s are on an ATAR track, but Bretlyn Bailey collated data showing increases in ATAR recipients in 2023 and 2024. These are the people most likely to apply for the 2025 academic year, the applications data examined in this post.
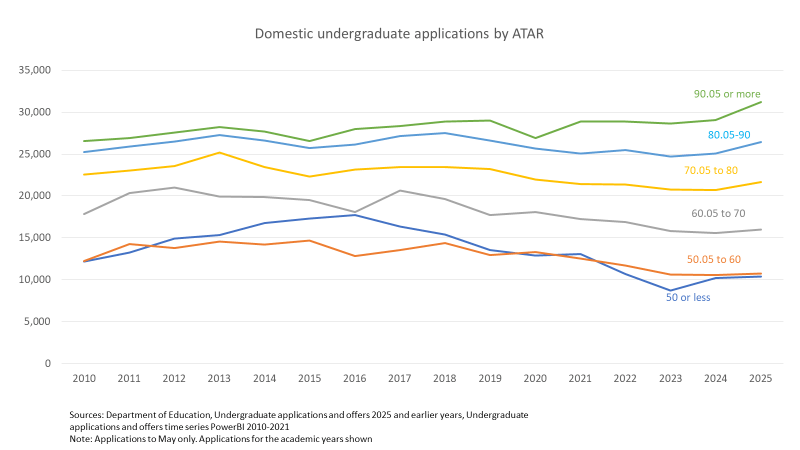
ATAR
The proportion of of school leavers with ATAR applications data has declined since 2021 from 95% to 87%. Presumably people who would have received a low ATAR are most likely to pursue a non-ATAR option. However the number of low-ATAR applicants began a decline well before 2021, which is consistent with some enrolment movement from higher education to vocational education. The number of 80+ ATAR applicants increased strongly in 2025.
Conclusion
With all the terrifying AI stories – about what it might do to both the credibility of degrees and entry-level graduate employment opportunities – the 2025 and initial 2026 data offer universities some domestic enrolment hope.
