Mapping Australian higher education 2023 – October 2024 data update

Update 20/12/2025: More recent data here.

An updated version of Mapping Australian higher education is not on the horizon, but to extend the life of the 2023 version I have updated the data behind the charts and some tables. An Excel file with these and the two further updates mentioned below is here.

Further update 6/11/2024: The 2023 Student Experience Survey results have been released. Some question changes have broken the time series but the replacement question results are recorded.

Further update 12/11/2024: A careful reader has identified the missing higher education provider mentioned below and identified other errors in my institutes of higher education appendix. Hopefully the list is now correct and complete. This update also includes 2024 bachelor and above attainment data.

The original pdf with explanatory text is here.

Some noteworthy changes since its publication:

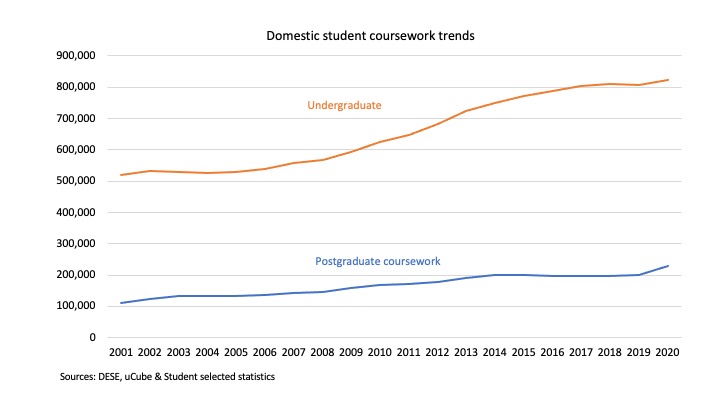
  • We now know that domestic enrolments fell in both 2022 and 2023; enrolments last declined in 2004 (figure 3)
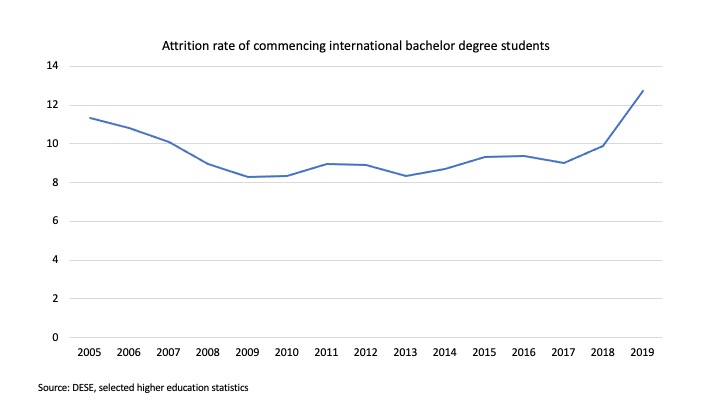
  • International students – although no regular reader of this blog needs this pointed out – recovered strongly from the COVID period (figure 10)
  • The source country skew of international students means that a top 15 source country does not necessarily send a lot of students, but for the first time an African country made it to the list, Kenya with 6,538 students in 2023 (figure 11) (and 7,330 onshore YTD July in 2024).
  • Higher education student income support recipient numbers continued to fall, to 156,710 in mid-2023, the lowest figure since 2009 (figure 18). While since 2022 falling income support recipients is partly due to fewer students, except for a COVID spike the number has been in structural decline since 2017.
  • Staff numbers recovered strongly in 2023 to be roughly what they were in March 2020 (figure 19)
  • HELP repayments increased increased significantly, from $5.56 billion in respect of 2021-22 to $7.8 billion in respect of 2022-23 (figure 31B). Most of this was due to voluntary repayments increasing from $780 million to $2.9 billion, as debtors sought to evade high indexation (some of which will be refunded if the indexation reduction bill passes).
  • Short-term graduate full-time employment rates improved, in 2023 reaching the best level since 2009 (figure 40)
  • The number of higher education providers continued to increase, from 198 in mid-2023 to 211 in October 2024 (appendix A and appendix B).

The Department of Education’s failure to release the 2023 Finance or Student Experience Survey publications means that the update is not as full as I would like.

A National Student Ombudsman – how would this new student complaints mechanism work?

Last week the government introduced legislation for a National Student Ombudsman.

This post outlines key provisions of the bill. A government summary is here. A subsequent post looks at the potential impact of the bill on academic life.

Statutory references are to the Universities Accord (National Student Ombudsman) Bill, using the sections as they would appear in the Ombudsman Act 1976 if the bill passes.

Which students can complain?

All students of higher education providers, except those enrolled in VET courses, can complain to the National Student Ombudsman (abbreviated to Ombudsman from now). Apart from the VET exception, non-higher education students are included. Enabling, microcredential and professional development course students will be covered. In some cases prospective or former students can also make complaints: sections 3(1) and 21AD(1)(a).

Another person can make a complaint on behalf of the student: section 21AD(1)(b).

Read More »

What’s going on with domestic undergraduate numbers? Part 1, Demographic differences

Higher education enrolment data for 2022 was released on Monday. Overall enrolments fell 3.2% in 2022 compared to 2021. A 1.9% increase in international student numbers partly offset a 5.1% decline in domestic numbers. In 2021 overall enrolments also fell, with the opposite dynamic – an increase in domestic students partly offset a decline in international student numbers. The 2021 and 2022 enrolment decreases were the first total enrolment reversals since the early 1950s.

Domestic undergraduates

This post focuses on domestic undergraduates, the subject of many media inquiries and much speculation. The chart below shows that enrolments started growing in the late 2000s, at a fast rate during the demand driven funding era, before entering a more subdued phase in the late 2010s and then the decline discussed in this post. Sub-bachelor courses are a larger share of the total more recently than in the 2000s.

Overall domestic bachelor enrolments decreased 4.9% in 2022 compared to 2021. Despite a 2 percentage point increase in attrition rates for commencing 2021 students into 2022, the continuing cohorts offset a larger fall in commencing bachelor-degree students of 8.6%. That’s more than double the previous largest commencing student decline this century, in 2003, when the then-minister cracked down on over-enrolments. Sub-bachelor numbers are down around 4% for both commencing and total.

Read More »

Mapping Australian higher education 2023 – official release

Update 20/12/2025: More recent data here.

Mapping Australian higher education 2023 is now available from the ANU Centre for Social Research and Methods website.

Update 30/10/2024: There is a later version of Mapping 2023’s data here.

Update 26/10/23: A reader has pointed out that list of FEE-HELP NUHEPs is incomplete. A column of names from the original Excel file was omitted during production. The full list is available here. This list also includes three non-FEE-HELP providers registered by TEQSA since the pdf version was finalised. A corrected version of Mapping with the full list of NUHEPs, as of mid-2023, is here.

If anyone has noticed other errors please let me know.

Patterns of international student enrolment decline in the first year of COVID-19

For international students the 2020 higher education enrolment data released this week is already very out-of-date. The international branch of DESE produces more current aggregate numbers, and has been circulating up-to-date figures to experts and stakeholders. Peter Hurley used these in a recent Conversation article. It’s a model for what, after a recent IT upgrade, could and should be done for domestic enrolments (my long-after-the-fact analysis of the 2020 domestic results is here).

Although more recent current total international enrolment figures are available, a few things in the recently released 2020 enrolment data tell us more than is publicly available elsewhere.

Attrition

International bachelor degree students have much lower attrition rates after first year than their domestic counterparts. Flying to a foreign country and paying sometimes exorbitant fees is a strong incentive to get the degree. But while attrition for 2019 commencers into 2020 declined for domestic students, the international rate increased nearly 3 percentage points to 12.73 per cent. The most likely reason is that some international students could not get back to Australia due to travel bans.


Commencing and continuing students

Increased attrition meant fewer continuing students than would have been the case without COVID-19. But the prior boom years for commencing students meant that continuing students still increased in 2020 on 2019 figures. This is one reason why the overall decline in international students was contained to 6.6 per cent, despite an 18.2 per cent decrease in commencing numbers.

Read More »

Domestic student enrolment increases in the first year of COVID-19

The 2020 higher education student data has finally been released, giving us the first detailed look at potential COVID-19 influences on enrolments. This post is on domestic students. Another post examines international students.

Aggregate trends

Overall domestic student trends were positive for both undergraduates, up 2 per cent after a decline between 2018 and 2019, and postgraduate coursework, up 14 per cent after six years of stagnation or low growth. Postgraduate research was an exception, down by 577 enrolments or 1.3 per cent. Including enabling and non-award students total domestic enrolments were 1,133,519, 4.4 per cent up on 2019.*

Student ‘load’ – full-time equivalent enrolments – was up by less, 2.6 per cent. The headcount share of part-time students, defined as less than 75 per cent of a full-time equivalent study load, is only up by .7 of a percentage point, suggesting more part-time students with light study loads and/or more full-time students not at a 100 per cent study load.

Read More »

Teaching public funding is skewed to STEM and health-related courses

With the government now publishing data on students by funding cluster we can get a clearer idea of where Commonwealth Grant Scheme money goes.

My calculations are for 2018, and based on multiplying equivalent full-time student numbers in Commonwealth supported places by the relevant funding cluster rate. Due to the demand driven funding freeze and some universities over-enrolling allocated places the overall total exceeds what universities were actually paid. However, as it is usually not possible to specifically identify ‘over-enrolled’ students I am going to assume that this does not affect relativities between the clusters.

As the chart below shows the science, engineering and surveying funding cluster is by far the biggest recipient of Commonwealth funds, at $1.8 billion in 2018 (and this is missing the maths and statistics buried in another cluster). The health-related clusters between them received $1.6 billion, and this is also an under-count due to some health courses being in other clusters.

funding cluster spend 2018 (all)

As is the case with public research spending, public tuition subsidies are skewed to STEM and health clusters. They have 32 per cent of EFTSL but 48 per cent of funding. The humanities, which are the subject of much of the controversy around higher education, received the least money of any cluster, $151 million in 2018. This is 2.1 per cent of the total.

However, it should be noted that other subjects typically taught in Arts faculties are in other funding clusters. For example, fields such as politics and sociology are in the second largest funding cluster by dollars (which also includes psychology, social work, and similar fields) and in the fourth largest funding cluster by dollars, which includes foreign languages and media and communications, which despite a recent downward trend has grown significantly over the last decade.

(Last paragraph added after original publication after Twitter commentary.)

What is going on with domestic bachelor-degree completions?

Historically, increases in commencing bachelor-degree students flow through into increased completions in the three to five years afterwards. And initially the demand driven boom of 2009 to 2014 looked like previous patterns. The increased commencing cohort sizes, shown lagged by four years by the orange line in the chart below, are evident in larger completing cohorts between 2012 and 2015 (blue line). 4 year lagged commencers and completors

But then growth in completions slows to a near stall in 2017, which had 0.3% more completions than in 2016. In 2018 there were 2.2% more completions than in 2017, but this still looks surprisingly low. If there had been the same relationship between completions and commencements four years later in 2018 as there had been in 2008, nearly 26,000 more people would have finished their degrees in 2018 (grey line in the chart above). Read More »

The popularity of online self-education

A couple of weeks ago I posted on the surprising apparent decline of reskilling and retraining. Mature-age undergraduate, postgraduate, vocational qualification, ABS work-related training, and ATO self-education expenses have all trended down in recent years. These trends did not seem consistent with the oft-repeated claims of workplace change and the need to reskill and retrain.

Especially on LinkedIn, much of the reaction to the post suggested that this was due to online self-education as a substitute for credentialed and uncredentialed courses and training. While I haven’t found any time series data on how online self-education  has grown, I am persuaded that this must be a significant part of the explanation.

In a recent Pearson global survey of learners, employed respondents who required further training were asked how they did it. In Australia, organised courses or training are still more widely used than online self-education. But a third of the sample had used this method (chart below).

use Pearson

Read More »

Contrary to expectations, reskilling and retraining seem to be in decline

We are regularly being told that in an era of technology-driven labour market change we will need to reskill and retrain much more than we did in the past. Perhaps we will. But it is hard to find evidence for this in the available data.

Let’s start in higher education. As I have noted before, mature-age undergraduate education is trending down. But domestic postgraduate coursework commencing student numbers are also down on their 2014 peak, as seen in the chart below. Education and business courses are driving the decline. Only health and IT courses have enjoyed enrolment increases since 2014.

Total student numbers are still high by historical standards. But with record numbers of eligible students (people who already have degrees), and undergraduate initial professional entry courses being converted into postgraduate qualifications, we would expect strong growth in this type of qualification. It is not happening.

postgraduate commencers

In vocational education too enrolments are trending down, including for people who already have a Certificate III or above qualification (taking the Certificate III as more clearly a career qualification than Certificates I or II). Read More »