2024 graduate employment outcomes and early 2025 trends

The 2024 Graduate Outcomes Survey finally came out this week. As recently as 2021 the GOS came out in the year it covered, not September the following year. The government’s inability/refusal to release data in a timely way means that we need alternative sources of information for sector-relevant trends. This post reports on the GOS and brings in job advertisement and ABS data.

2024 graduate employment results

What I found in alternative sources for 2024 graduate outcomes made me concerned. The ABS labour force survey showed a downward trend in employment for young graduates. If this was right, was it cyclical or something more structural, such as AI reducing entry-level employment? A couple of recent US studies, one specifically looking at recent graduates, suggested an AI impact.

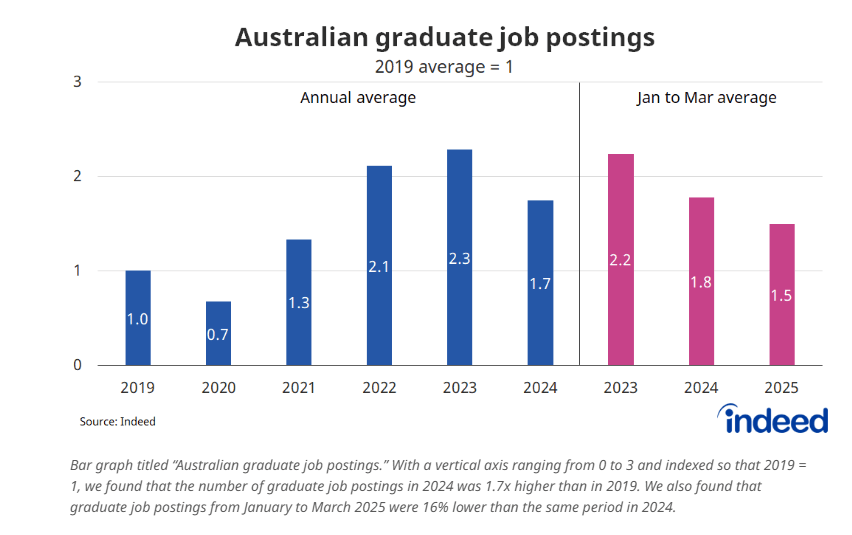
In May 2025, Callam Pickering looked at online job ads for graduates. He found that ads mentioning graduates declined in 2024 compared to 2023 – although they still exceeded 2019 levels. At least to March, ads for graduates in 2025 were tracking below the same months in 2024.

Fewer job ads targeting graduates cannot be good news, but I am not sure how important these are to the overall graduate labour market. There would be jobs typically taken by recent graduates that are not part of graduate programs or exclusively marketed to graduates. As work-integrated learning becomes more common, are firms increasingly hiring people they already know, recruiting graduates but not using advertising to find them? In analysis based on the 2023 GOS, but only graduates from institutions that had paid extra for WIL questions, 19% of people with new undergraduate qualifications said they had secured employment with a WIL employer and another 10% through a network contact made during their WIL experience.

Read More »

Gender-based violence legislation, Part 3: Reporting and penalties for higher education providers

The first post in this series outlined the meaning of gender-based violence and processes that apply to all higher education staff and students. The second post looked at processes when a complaint of gender-based violence is made.

Legislative references, unless otherwise specified, are to the Universities Accord (National Higher Education Code to Prevent and Respond to Gender‑based Violence) Bill 2025. The draft code is here; it uses the language of ‘standards’ but I will refer to code ‘sections’ when noting a specific rule or requirement.

Update 20/10/2025: The enacted legislation is here. The enacted code is here.

Reporting

The code comes with very extensive reporting requirements. All the different things providers must report on run for four pages in the code: standard 6, pp. 17-20.

The code stresses the role of the data collected on programs to reduce gender-based violence: code section 6.1.

The Secretary can disclose information received as part of this reporting: sections 43 and 44.

The Secretary must produce an annual report to be included in the Department’s annual report (which is usually tabled in Parliament in October): section 47.

Given the Department of Education’s chronic failure to release higher education data in a timely way a statutory requirement to publish an annual report is good.

While the Department’s annual report operates on a financial year basis it would be helpful to produce the data on a calendar year basis as well, to reflect the operating cycle of universities.

Read More »

Gender-based violence legislation: Part 2, Processes for victims and perpetrators

My first post on the higher education gender-based violence bill and its draft code looked at how gender-based violence is defined and the broad obligations placed on higher education providers and their staff and students.

This post examines procedures for student victims of gender-based violence and for the accused perpetrators. The rules also apply to staff, but as there are existing laws on these matters for workplaces I will focus on students. There is a 2024 summary of university policies and practices on responding to sexual violence, but I have not attempted to compare them to the code.

The code includes reasonable measures to support student victims and, to a lesser extent, accused respondents. I am not convinced, however, that the latter will face a fair process in more serious cases if universities rely on the code alone to guide their policies.

Update 20/10/2025: The enacted legislation is here. The enacted code is here.

Student victims/disclosers

A common criticism of universities has been inadequate responses to student complaints regarding sexual misconduct. In a 2021 student survey on sexual harassment and assault most victims did not report their experience to the university, but of those who did over 40% were dissatisfied. The code includes an extensive list of things that providers must do in these cases: code section 4 (all legal references unless otherwise stated are to the draft code).

These required provider actions include implementing measures to ensure the safety of the discloser, prioritising urgent access to support services, minimising how often the discloser must repeat their story, providing translation and interpretation services where necessary, implementing academic adjustments, and where necessary discussing the investigation and disciplinary processes: code section 4.6.

The discloser must have the opportunity for a support person to be present: code section 5.11.

Read More »

Gender-based violence legislation: Part 1, Definitions and requirements for all higher education providers, staff and students

Legislation on ‘gender-based violence’ in higher education is back in Parliament. Its principal purpose is to provide a legal foundation for a National Higher Education Code to Prevent and Respond to Gender-based Violence. This will be a legislative instrument made after the legislation is passed, but the minister has released its expected contents.

The code is scheduled to start on 1 January 2026 for universities and 1 January 2027 for other providers.

This post looks at the definition of gender-based violence, extension of the policy beyond higher education providers, and policies that will affect all staff and students. A second post looks at procedures for victims and perpetrators of sexual harassment or assault. A third post looks at reporting and penalties for higher education providers (apologies, but this is all much briefer than the 75-page original; 45 pages in the bill and 30 in the code).

Update 20/10/2025: The enacted legislation is here. The enacted code is here.

What is gender-based violence?

According to the bill, ‘gender‑based violence means any form of physical or non‑physical violence, harassment, abuse or threats, based on gender, that results in, or is likely to result in, harm, coercion, control, fear or deprivation of liberty or autonomy’: section 5 (legislative references, unless otherwise specified, are to the Universities Accord (National Higher Education Code to Prevent and Respond to Gender‑based Violence) Bill 2025).

Read More »

Graduate income fluctuations and HELP repayment

Last week I raised concerns about the new HELP repayment system increasing the number of HELP debtors who face very long repayment times or lifetimes of student debt.

The calculations in that post assumed that people maintained their relative income position through their careers – for example that someone who earned the median income at age 25 would still do so at age 35, 45 etc. We know, however, that relative income fluctuates. Family commitments drive movements in and out of full-time work. Careers go better or worse than expected.

Without solving the problems involved in estimating how these changes affect HELP repayments, this post outlines findings on graduate income mobility and labour force status changes.

Movements between income quintiles

The chart below uses data from a Productivity Commission report on economic mobility. It shows changes in relative income, between five economic quintiles, over a decade since degree completion. The data source is HILDA.

Quintile 5, the highest, shows strong stability. More than 80% of graduates in quintile 5 were still there or in quintile 4 a decade later. The high starting point and following stability may be due to people already doing well in their careers acquiring postgraduate qualifications.

The other quintiles all show significant movement in relative income. Upward movement is expected as we know graduate incomes increase in the years after course completion. Almost half of graduates in the lowest quintile in year one are in the top two quintiles a decade later.

Bu there is also some stability at the lower end. In the two lowest quintiles, 1 and 2, over a quarter remain in those quintiles a decade later. In quintile 3 we see a similar share falling back to quintiles 1 and 2. While some of this is career stagnation, ten years out takes into the ages when women start leaving full-time work to meet family responsibilities.

Read More »

The new HELP repayment system and lifetimes of student debt

The prime minister says that a degree should not come with a lifetime of debt. For that goal, the government’s HELP legislation introduced last week is contradictory. It will cut all debt owed as of 1 June 2025 by 20%, which will shorten repayment times for current debtors. But it will also cut annual debt repayments for 99% of debtors, which will lengthen compulsory repayment times for many and push others into the PM’s lifetime of debt.

In the analysis below, female debtors owing $25,000 or more with incomes in the lowest 40% of graduate earnings face an increased risk of a lifetime of student debt. However, what percentage of female debtors actually face a lifetime of debt will depend on initial debt levels and how much their incomes vary through their careers. Voluntary repayments can also affect repayment times.

How the repayment system will change

My previous post on the initial threshold summarised how the repayment system will change. The key elements are that 1) repayment exempt incomes will include everyone on $67,000 or less compared to less than $56,156 now and 2) a marginal rather than total income repayment system will reduce what most debtors repay, particularly at lower income levels.

The chart below shows how this will affect HELP debtors at different annual income levels. Based on 2022-23 ATO data I estimate that 99% of debtors repaying under current thresholds will repay less per year than under the current system. The other 1%, all high income earners, will repay the same amount per year as now.

Read More »

Mapping Australian higher education 2023 – data update March 2025

Update 20/12/2025: More recent data here.

—————————————————————————————————

I won’t have the capacity to produce another edition of my Mapping Australian higher education report in the foreseeable future, but I am extending the life of the October 2023 edition by updating the data behind the charts.

Mapping‘s chart data is the only publicly-available source of long-term time series data on many higher education topics, especially on financial matters.

I had been waiting on the 2023 university finances report before releasing another chart data update. That finally happened yesterday. Despite a record 27 universities reporting deficits, in the aggregate there was a small surplus, after a loss overall in 2022.

2023 had some weak numbers for the two main Commonwealth student programs, the Commonwealth Grant Scheme and HELP. Several factors were behind this: temporary COVID places coming out of the system, Job-ready Graduates reductions in total funding rates for some courses, and weak domestic demand. These programs trended up in 2024 and 2025, as seen in the chart below, although high CPI-driven indexation was a significant factor.

The updated chart data is available here.

The higher education participation rate at age 19 almost certainly fell in 2023 – but an exact rate cannot be calculated

Despite significant policy interest in higher education attainment rates, the preceding participation rates are rarely reported. The most readily available time series is in Mapping Australian higher education, at figure 5 of the 2023 edition. It reports the participation rate at age 19 years, the modal university student age. For the first time in decades, the Department of Education recorded a participation rate in their recent 2023 statistics release.

Unfortunately data issues mean participation figures are only estimates. This post discusses these data problems and compares participation rates using two different methodologies. Both point to participation in 2023 being lower than in all recent years.

Read More »

Domestic student enrolment increases in the first year of COVID-19

The 2020 higher education student data has finally been released, giving us the first detailed look at potential COVID-19 influences on enrolments. This post is on domestic students. Another post examines international students.

Aggregate trends

Overall domestic student trends were positive for both undergraduates, up 2 per cent after a decline between 2018 and 2019, and postgraduate coursework, up 14 per cent after six years of stagnation or low growth. Postgraduate research was an exception, down by 577 enrolments or 1.3 per cent. Including enabling and non-award students total domestic enrolments were 1,133,519, 4.4 per cent up on 2019.*

Student ‘load’ – full-time equivalent enrolments – was up by less, 2.6 per cent. The headcount share of part-time students, defined as less than 75 per cent of a full-time equivalent study load, is only up by .7 of a percentage point, suggesting more part-time students with light study loads and/or more full-time students not at a 100 per cent study load.

Read More »

Did COVID-19 reduce female domestic enrolments?

After the annual release of the ABS Education and Work data last November articles appeared suggesting that female university enrolments might have been hit particularly hard by COVID-19.

I could think of a couple of plausible mechanisms. With children sent home from school and childcare restricted women might have given up study, at least temporarily, to look after their kids. The difficulty of doing required clinical placements and teaching rounds during COVID-19 workplace disruptions might have triggered deferrals, which would probably affect women more than men due to their their large majorities in health and education courses.

On the other hand, the quoted fall in female enrolments – 86,000 – was struggling to pass my ‘does it look right?’ test. And the source, Education and Work, which is conducted each May, has a history of rogue results. It is a sample survey of Australian residents rather than being derived directly from enrolment data. The further users drill down into Education and Work sub-categories – gender, type of enrolment, age group etc – the less reliable it gets (the ABS is upfront about this, and publishes relative standard errors).

Last November I used the TableBuilder version of Education and Work (expensive paywall; university staff can use it) to exclude international students. That caused the female decline in enrolments to go way and became a small increase, although with a narrowing of the gender gap. In 2019 Education and Work reported 1.5 female students for every 1 male student, which declined to 1.42 to 1 in 2020.

Read More »