Mapping Australian higher education – December 2025 data update

To prolong the life of Mapping Australian higher education 2023 I have been updating a spreadsheet which contains the data behind the charts and tables.

The December 2025 Mapping data update is here.

Since the last update in March 2025 the changes include the 2024 enrolment data, the 2024 university financial information, and graduate employment outcomes.

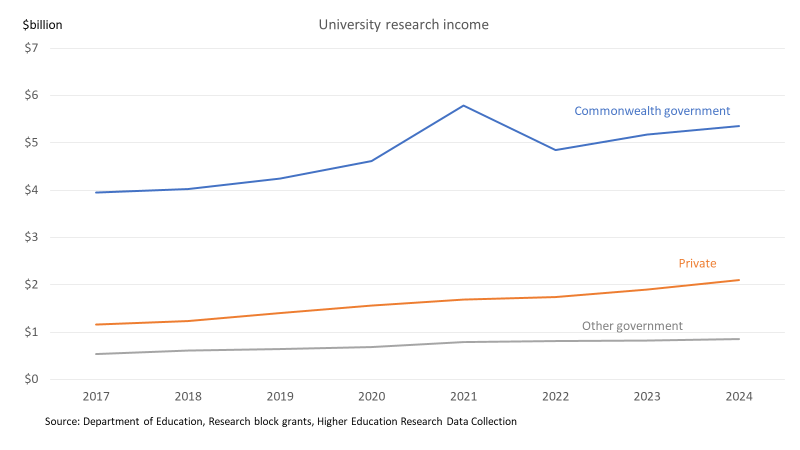
Research income has been the most recent significant data release, including research block grant funding for 2026 and the HERDC data used to calculate it, which goes up to 2024. The chart below shows the research-specific income sources 2017-2024.

I will next update the spreadsheet when we have projected 2026 spending on Commonwealth supported places in the first quarter of 2026. I hope by then the 2025 staff data will also be available.

Mapping Australian higher education 2023 – data update March 2025

Update 20/12/2025: More recent data here.

—————————————————————————————————

I won’t have the capacity to produce another edition of my Mapping Australian higher education report in the foreseeable future, but I am extending the life of the October 2023 edition by updating the data behind the charts.

Mapping‘s chart data is the only publicly-available source of long-term time series data on many higher education topics, especially on financial matters.

I had been waiting on the 2023 university finances report before releasing another chart data update. That finally happened yesterday. Despite a record 27 universities reporting deficits, in the aggregate there was a small surplus, after a loss overall in 2022.

2023 had some weak numbers for the two main Commonwealth student programs, the Commonwealth Grant Scheme and HELP. Several factors were behind this: temporary COVID places coming out of the system, Job-ready Graduates reductions in total funding rates for some courses, and weak domestic demand. These programs trended up in 2024 and 2025, as seen in the chart below, although high CPI-driven indexation was a significant factor.

The updated chart data is available here.

Mapping Australian higher education 2023 – October 2024 data update

Update 20/12/2025: More recent data here.

An updated version of Mapping Australian higher education is not on the horizon, but to extend the life of the 2023 version I have updated the data behind the charts and some tables. An Excel file with these and the two further updates mentioned below is here.

Further update 6/11/2024: The 2023 Student Experience Survey results have been released. Some question changes have broken the time series but the replacement question results are recorded.

Further update 12/11/2024: A careful reader has identified the missing higher education provider mentioned below and identified other errors in my institutes of higher education appendix. Hopefully the list is now correct and complete. This update also includes 2024 bachelor and above attainment data.

The original pdf with explanatory text is here.

Some noteworthy changes since its publication:

  • We now know that domestic enrolments fell in both 2022 and 2023; enrolments last declined in 2004 (figure 3)
  • International students – although no regular reader of this blog needs this pointed out – recovered strongly from the COVID period (figure 10)
  • The source country skew of international students means that a top 15 source country does not necessarily send a lot of students, but for the first time an African country made it to the list, Kenya with 6,538 students in 2023 (figure 11) (and 7,330 onshore YTD July in 2024).
  • Higher education student income support recipient numbers continued to fall, to 156,710 in mid-2023, the lowest figure since 2009 (figure 18). While since 2022 falling income support recipients is partly due to fewer students, except for a COVID spike the number has been in structural decline since 2017.
  • Staff numbers recovered strongly in 2023 to be roughly what they were in March 2020 (figure 19)
  • HELP repayments increased increased significantly, from $5.56 billion in respect of 2021-22 to $7.8 billion in respect of 2022-23 (figure 31B). Most of this was due to voluntary repayments increasing from $780 million to $2.9 billion, as debtors sought to evade high indexation (some of which will be refunded if the indexation reduction bill passes).
  • Short-term graduate full-time employment rates improved, in 2023 reaching the best level since 2009 (figure 40)
  • The number of higher education providers continued to increase, from 198 in mid-2023 to 211 in October 2024 (appendix A and appendix B).

The Department of Education’s failure to release the 2023 Finance or Student Experience Survey publications means that the update is not as full as I would like.