University funding systems and what graduates see as important in a job

For a side-project I’ve recently engaged with the subject of whether higher education funding systems shape the educational and career choices of students and graduates.

On one theory, where fees are charged students focus more on courses and jobs with high pay. Courses that satisfy intrinsic interests but do not offer good salary prospects would be less popular in countries with fees or after fee increases. Focus-group research on the views of students in European countries provides some support for this view (I have not cross-checked this against enrolments).

Under fee systems, depending on loan arrangements, taking courses with good job prospects may be necessary to reduce the risk of default on student debt repayments.

On another theory, also with some evidence from the European focus-group research, students in fee-paying countries may be more interested in courses that lead to personal financial rewards than courses that serve some broader public purpose. There are echoes of this argument in the local complaint that Australian higher education in the ‘neoliberal’ fee-charging era has lost sight of the ‘public good’.

I’ve discussed the role of interests in course choices before. In this post I look at the attitudes of graduates. My data source is survey evidence from the International Social Survey Programme. Unfortunately Australia only occasionally participates in these multi-nation comparative studies, but the ISSP’s 2015 work orientation questionnaire has Australian data.

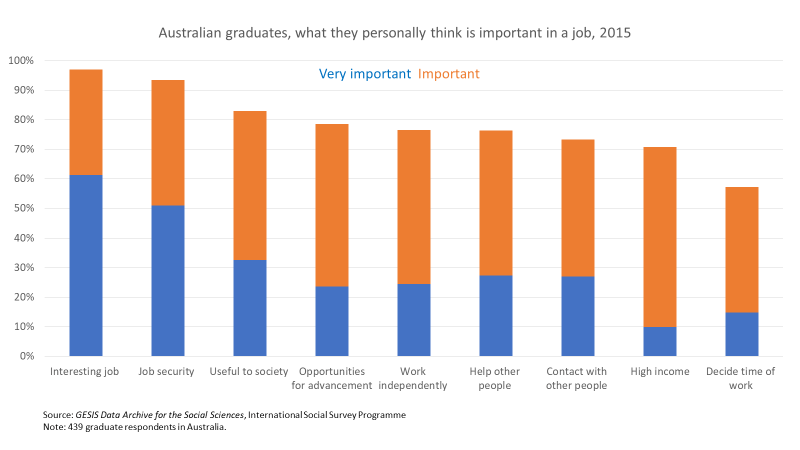
What Australian graduates see as important in a job

In the ISSP respondents are asked what job attributes they personally see as important.

A job being interesting is the single-most desirable attribute of a job for Australian graduates. This is consistent with interests being the dominant factor in course choice.

The ISSP question has two other-regarding options, being useful to society and helping other people. I presume helping others is a hands-on form of being useful, such as a teacher or nurse, while a policymaker, engineer or executive can produce useful-to-society structures and systems without directly helping specific individuals.

Perhaps because being useful to society is more general it is rated above helping others, and is the third mostly highly rated attribute overall.

Only 10% of graduates rate a high income as very important, the lowest of any attribute and the overall importance of money is the second-lowest of the options given. Money is nice to have but other job attributes are more important.

Read More »

Mapping Australian higher education 2023 – data update March 2025

Update 20/12/2025: More recent data here.

—————————————————————————————————

I won’t have the capacity to produce another edition of my Mapping Australian higher education report in the foreseeable future, but I am extending the life of the October 2023 edition by updating the data behind the charts.

Mapping‘s chart data is the only publicly-available source of long-term time series data on many higher education topics, especially on financial matters.

I had been waiting on the 2023 university finances report before releasing another chart data update. That finally happened yesterday. Despite a record 27 universities reporting deficits, in the aggregate there was a small surplus, after a loss overall in 2022.

2023 had some weak numbers for the two main Commonwealth student programs, the Commonwealth Grant Scheme and HELP. Several factors were behind this: temporary COVID places coming out of the system, Job-ready Graduates reductions in total funding rates for some courses, and weak domestic demand. These programs trended up in 2024 and 2025, as seen in the chart below, although high CPI-driven indexation was a significant factor.

The updated chart data is available here.

Mapping Australian higher education 2023 – official release

Update 20/12/2025: More recent data here.

Mapping Australian higher education 2023 is now available from the ANU Centre for Social Research and Methods website.

Update 30/10/2024: There is a later version of Mapping 2023’s data here.

Update 26/10/23: A reader has pointed out that list of FEE-HELP NUHEPs is incomplete. A column of names from the original Excel file was omitted during production. The full list is available here. This list also includes three non-FEE-HELP providers registered by TEQSA since the pdf version was finalised. A corrected version of Mapping with the full list of NUHEPs, as of mid-2023, is here.

If anyone has noticed other errors please let me know.

Little sign in Australia of conservatives losing confidence in universities

In the United States, the general public has an increasingly negative view of universities. In 2019, 38 per cent of respondents to a Pew Research Center survey said that universities had a negative effect on the way things are going in the country, up from 26 per cent in 2012.

In Australia, there is no directly equivalent question but successive questions on confidence in universities find that around three-quarters of respondents have a ‘great deal’ or ‘quite a lot’ of confidence in universities. The numbers are down slightly on their peak, but above where they were at the start of the century. With other important institutions scoring poorly on this question, university ratings are high and resilient.

confidence in universities

In the US, the decline is driven by Republican voters. They share with Democrats concerns about tuition costs and employment outcomes, and also believe that students are protected too much from views they might disagree with and that academics bring their political beliefs into the classroom. There are some parallel critiques in Australia, with worries about free speech and  left-wing bias in some courses.

So far, however, these concerns are not significantly influencing how Coalition voters perceive universities. As the chart below shows, about three-quarters of them have confidence in universities, compared to 80 per cent or more for supporters of left-wing parties. It is people who don’t support any party or prefer a minor party who have the lowest confidence in universities.

Partisan confidence in universities

Read More »

Public opinion on special admission standards for Indigenous university applicants

In the United States, racial preference in university admissions is a highly controversial issue. But in Australia universities have long had special admissions programs for Indigenous applicants, with little obvious controversy. So far as I am aware the latest ANU Poll, on Indigenous affairs, is the first to ask the general public what they think.

As the chart below shows, a small majority of respondents, 54%, favoured special programs and admission standards for Aboriginal people. This was lower than support for governments helping Aboriginal people find employment (69%) or who think the private sector should do more to employ Aboriginal people (66%).

It’s hard to explore the reasons for these results from within this survey. However there are common ideas around minimum entry standards (as seen in the annual January low ATAR debate), and using ranked prior academic performance to allocate scarce places, that would influence views on university admission more than staff hiring practices.

Indigenous

An electorate than thinks government does too much, except for all the areas in which it does too little

Today’s Essential Research poll highlights the perils of trying to draw any specific policy conclusions from public opinion on high-level questions.

First, its respondents were asked about the size of government, and the answer suggested that perhaps a large number of voters had suddenly converted to classical liberalism:

But more specific questions suggest that the vague feeling that governments are too big does not translate into wanting government to do less in key areas of activity. In every proposition put to the Essential respondents, a plurality wanted the government to do more, and in most clear majorities wanted the government to do more. The 44% of respondents who earlier in the survey had thought government did too much shrank to a constituency of between 1% and 10%.

This is why governments have so much trouble cutting spending, and why genuine ‘tough budgets’ are very rare.

Why is there no liberal party?

Last weekend, Don Arthur asked ‘why is there no liberal party?’ By which he meant, why is there no significant political party supporting social and economic freedom?

I’ll leave the deep reasons to one side. But the proximate reason is that the constituency for such a party is very small. So small that I probably know a large proportion of them personally.

The 2010 Australian Election Survey isn’t quite designed to explore the electoral realities. But it has a number of questions that are reasonably open to classifying the answers as ‘liberal’ or ‘not liberal’.

1. Size of government
I deemed agreeing with the proposition that ‘there are more things the government should be doing’ as non-liberal and ‘the less government the better’ as liberal. Liberals=25%.

2. Tax and spend
In response to the question ‘if the government had a choice between reducing taxes or spending more on social services, which do you think it should do?’ I deemed a liberal response as agreeing or strongly agreeing with lower tax. Liberals=37%.

3. Censorship
I deemed the liberal answer to the statement ‘the right to show nudity and sex in films and magazines’ as ‘not gone far enough’ or ‘not gone nearly far enough’. Liberals=9%. Though in this case ‘about right’ is probably a defensible response from a liberal perspective, on about 45%.

4. Drugs
For the proposition, ‘the smoking of marijuana should NOT be a criminal offence’ I deemed the liberal answers as agree or strongly agree. Liberals=28%.

5. Immigration
This is more difficult to classify. I took the liberal answers to ‘Do you think the number of immigrants allowed into Australia nowadays should be reduced or increased?’ as increased a lot or a little. Liberals=11%.

6. Income redistribution
The AES question ‘income and wealth should be redistributed towards ordinary working people’ is not ideal; someone could agree with it in general terms but still think there should be less redistribution than now. But with this caveat I took disagreeing with it as a liberal – or at least classical liberal – response. Liberals=19%.

But the test of a social-economic liberal constituency is not just whether there are some liberal propositions that can win significant public support. It is whether there are enough people with liberal views across a range of issues.

The table below shows the proportion of liberal responses to the six issues. The one person who gave six out of six and the nine people who gave five out of six were rounded down to 0%. Saying three or more liberal answers makes a liberal gets us to 13%, with rounding. That’s half the proportion who gave liberal answers to zero of the six questions. Australians say they don’t like politicians much, but they have a strong belief in government shaping the social and economic structures of Australian society.

Federalism gaining in popularity

The recent ANU poll shows some turnaround in views on federalism:


Question: Some people think that in order to deal with Australia’s problems the state governments should
hand over some of their powers to the federal government in Canberra. Others think that the federal
government has enough power already. What is your own feeling on this? Do you think the state
governments should give some powers to the federal government, or do you think it has enough
powers already? If you have no opinion, just say so.

However I doubt there is any philosophical shift behind this opinion change. Rather, the apparent shambles in Canberra has undermined the federal alternative. The implicit lesson is unlikely to leave a permanent mark on public opinion.

What drives tax and spend opinion?

The latest ANU Poll finds, like all such polls in recent years, that given a choice between reduced taxes and increased spending on services, most people would go for the latter. Report author Professor Ian McAllister observes:

Public opinion on government spending tends to be both secular – in that it is largely unrelated to
partisan debates and changes in government – and cyclical – in that it is responsive to broader
economic conditions. For example, on the latter point, it has often been observed that national
electorates are more likely to favour spending on social services and welfare when economic conditions
are benign, and to favour reduced taxes when economic conditions become harsh.

I agree, having argued for this interpretation in a 2004 paper. But a few years ago Professor McAllister thought that other factors were at work. In a newspaper report on the 2007 version of the tax and spend question, he was reported as saying that:Read More »