With universities back job shedding, academics and their unions are looking for someone to blame. University leaders and consultants are being attacked for poor decisions. The government also gets criticised. UTS history professor Anna Clark says that over the last twenty years ‘we have seen gradual, steady decline in government investment across the sector’. In his recent lament Broken Universities, Graeme Turner says that there has been a ‘steady decline in the levels of funding per student’.
Five years ago, early in the COVID crisis, I wrote a post about government ‘cuts’. This post is an update.
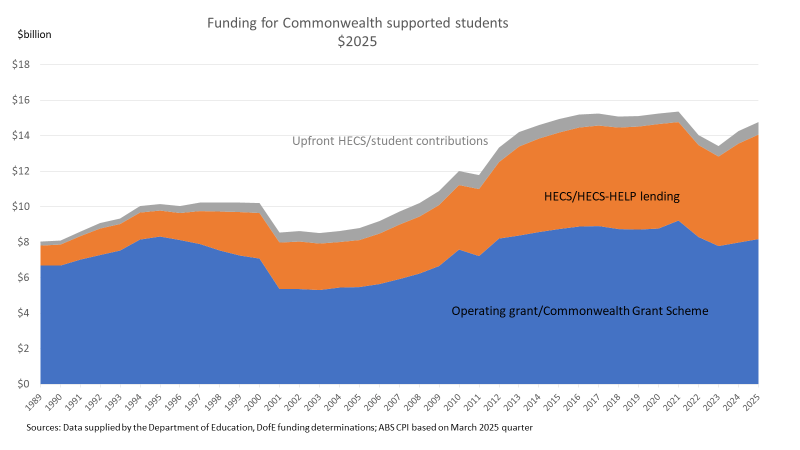
Funding for Commonwealth supported students
As my earlier post noted, time series data is not straightforward. The chart below focuses on the major student funding programs, in today’s terms the Commonwealth Grant Scheme (CGS), HECS-HELP, and upfront student contributions. These funding sources have always had a link to the number of full-time equivalent Commonwealth supported students, although historically the money they delivered supported research as well as teaching expenditure.
Around these core funding sources other schemes serve the same purpose (e.g. transition funding) or similar purposes (e.g. NPILF). The chart below includes the Job-ready Graduates (JRG) transition funding and but excludes NPILF. It includes money paid from the Higher Education Continuity Guarantee, a COVID measure still in place for universities that ‘under-enrol’ that would normally face a CGS penalty. From 2021-2024 the time series excludes the enabling course loading that was previously in the CGS but moved to IRLSAF. But this funding is back in the CGS in 2025 due to the FEE-FREE Uni Ready places. The regional loading remains out from 2021 as it is still in IRLSAF and will join needs-based funding next year.
Overall my time series goes for simplicity over a full count of expenditure on student-related programs. In the time series, one big structural change should be noted, which is research student funding moving to a separate program from 2001, which caused a significant but artificial year-on-year decline.
Trends in total funding
Focusing on recent times, in nominal dollar terms total CGS funding dipped between 2021 and 2022, which was mostly short-term COVID places coming out of the system. HECS-HELP lending fell between 2020 and 2021, driven by the strange decision to pass on reduced JRG student contribution rates to all current students but to grandfather increased student contribution rates, so that only 2021 and later commencing students pay them. HECS-HELP lending fell again in 2022, with lower student numbers also affecting revenue from a university perspective.

In nominal dollars we can see why higher education ‘cuts’ don’t look that way from Canberra. Since 2020 CGS grants are up by $900 million and HECS-HELP lending up by $1 billion, with total Commonwealth cash flow to universities for Commonwealth supported students a record $14 billion dollars in 2025.
Inflation-adjusted grants
The recent period of high inflation caused problems in higher education. For some reason I am not aware of, Commonwealth and student contributions are indexed according to a significantly lagged measure of inflation. And while Labor kept the Coalition’s unlegislated promise to index CGS higher education courses maximum grants to inflation that was also lagged.
A consequence of this is that modest nominal increases in the CGS and HECS-HELP in 2023 turn into reductions when adjusted for inflation, with real revenue still not fully recovered in 2025.
The long lags in inflation adjustments are a problem, as inflation-driven cost increases and compensating wage demands start flowing in well before the money to pay for them.
Funding per student – Commonwealth contributions
For average CSP funding per EFTSL there are the original issues with what is counted plus other issues of interpretation. I start the time series in 2001 to avoid issues with taking research student money out and finish in 2023, the latest year for EFSTL data.
Before 2005 the system did not specify per student funding rates. There was a block grant with a target number of EFTSL and so an average rate. This average varied between universities due to historical differences in their enrolment profiles (there is more detail about the history of funding rates in this paper).
The Nelson reforms, which began operation in 2005, introduced separate per EFTSL Commonwealth and student contributions that vary by discipline. Nelson is the only minister to increase per student funding above indexation, with Commonwealth contribution increases phased in over three years conditional on various reforms and 25% increases to most student contributions, above previous HECS levels.
Commonwealth and student contributions have been indexed annually, currently by CPI but by other methods in earlier years.
In the 2005-2025 period only JRG has cut overall per student funding rates, although it had increases for some courses.
When calculating averages the different Commonwealth contributions mean that compositional change – enrolment movements to disciplines with higher or lower Commonwealth contributions than in preceding years – can affect the results. Complicating matters further there are still grandfathered students funded at the old rates.
Average funding is also influenced by over-enrolments, for which universities receive the student contribution only, so the EFTSL is counted in the average with no corresponding CGS revenue. The drop in 2011 seen in the chart below is a by-product of the over-enrolment frenzy before the demand driven system began in 2012.
The increase in 2021 is due to transition funding temporarily offsetting lost student contribution revenue. In recent years the average has also been boosted by under-enrolled universities not being penalised with reduced CGS payments as they normally would be, as the Higher Education Continuity Guarantee maintains their revenues. In 2021 the government paid $119 million for non-delivered student places and in 2022 $345.8 million. I can’t find 2023 figures.
JRG had not as of 2023 produced any decline in average nominal CGS revenue per student. However there is a decline since the early 2010s in average CGS revenue per student after a CPI adjustment.

Funding per student – student contributions
The student contribution average includes some zero student contribution EFTSL in enabling places plus other EFTSL for which universities do not charge or charge less than the maximum amount. In 2020 there were discounted short course student contributions as a COVID measure. The JRG decision to immediately move all students in fields with reduced student contributions to the new rates can be seen in the fall in student contribution revenue per EFTSL in 2021. In 2022 the average student contribution was still less than it had been in 2020. In CPI-adjusted terms it still had not recovered to pre-JRG levels by 2023.

A lagged 7.8% student contribution indexation spike in 2024 should even things out, but the weakness of average student contribution revenue is still notable.
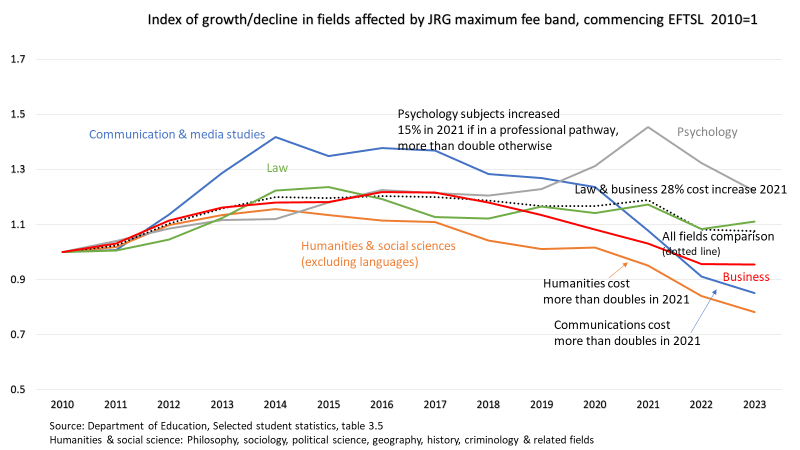
I have not done a full analysis of the compositional effects on the average. But a factor keeping the average down is crashing commencing enrolments in most fields with significantly increased student contributions under JRG (someone in the minister’s office really should tell him that the number of arts students has not increased – a myth he repeated as recently as the AFR conference this week).
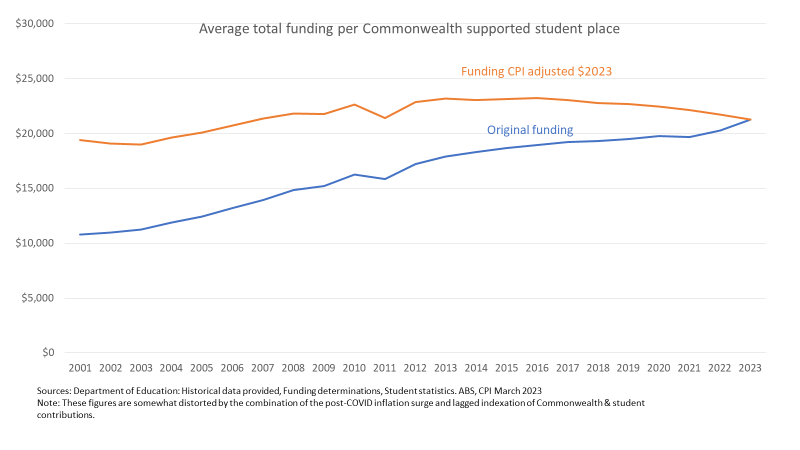
Total average funding per CSP place
Looking at total average funding per student place we get a similar overall pattern. Nominal rates of funding are increasing but not real rates of funding.
Costs
If we look at nominal funding rates and totals the overall trend is towards growth, but with exceptions in some years. The core problem is that funding growth is slower than increases in university expenses, especially wages.
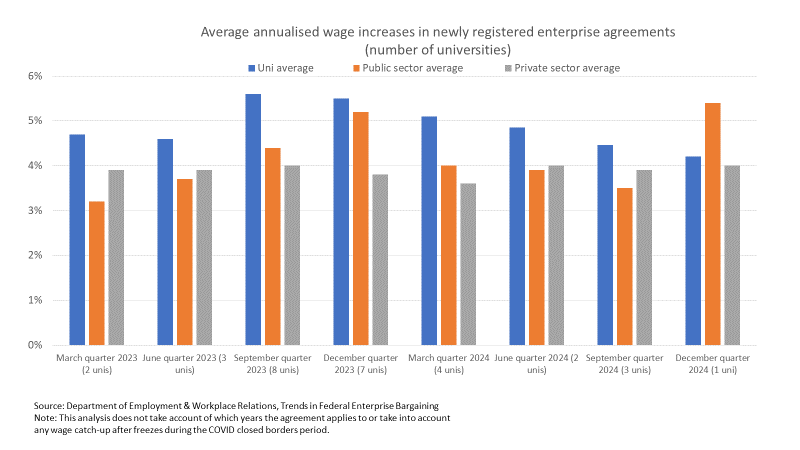
Post-COVID universities went on a hiring spree. They signed up to relatively generous enterprise agreements with average annual wages of 4%+ – above likely CPI indexation in the coming years (chart below). Conversion of casual staff to other contracts will add to the wage bill. The government also regularly ramps up compliance costs – support for students, National Student Ombudsman, gender-based violence.
Unless universities have significant non-CSP revenues they can use to finance these expenditure increases they have no choice but to cut costs. As wages are the largest cost staff need to be retrenched to keep revenue and expenses in balance.
A further observation I would make is that the JRG decision to fund each discipline at average teaching and scholarship costs had significant consequences. Removing ‘profit’ margins undermined the ‘swings and roundabouts’ aspect of the historical block grant system, which could use surpluses from some subjects/courses to sustain other subject/courses that could not fully cover their costs but were offered for mission reasons. With enrolment levels the biggest driver of subject costs courses with soft demand are being closed.
Conclusion
Contrary to common academic beliefs, cuts in total teaching grants or per student funding rates are rare. But how these grants are altered over time – with a lagged CPI adjustment – has significant cumulative consequences. While perhaps recent university enterprise agreements deliver overly generous wage increases, historically wages across the economy have increased by more than CPI. To stay competitive in the labour market, universities need to offer better-than-CPI wage increases. Unless that is taken into account in the way per student funding rate are set, universities will need to control costs by removing subjects, courses and academics that are not at least breaking even. That I think is what is happening now. Bad governance or management cannot help, but the logic of the funding system will drive similar behaviour across all universities.

Thanx for this most important contribution to the debate on Australian higher education financing.
Another important variable is universities’ spending on research, most significantly I expect by their proportions of academic staff appointed on teaching and research contracts, and the teaching load of teaching and research academics.
Both Labor and Coalition Australian governments clearly now believe that Commonwealth grants + HELP fund teaching only, so I expect both believe that there is scope to squeeze universities’ financing further.
I am not sure that most academics would be willing to trade higher average teaching loads for preserving staff levels in fields that are not at least breaking even on current funding rates, however valuable they may be considered in principle.
LikeLike