In his speech to the Universities Australia conference last month Jason Clare complained that the low SES share of enrolments ‘hasn’t changed that much in the last 30 years.’ He is overly pessimistic about long run trends in low SES higher education participation. But after 2017 key indicators went backwards, until a recent stabilisation with signs of partial recovery. This post explores trends and speculates on causes.
School leaver participation
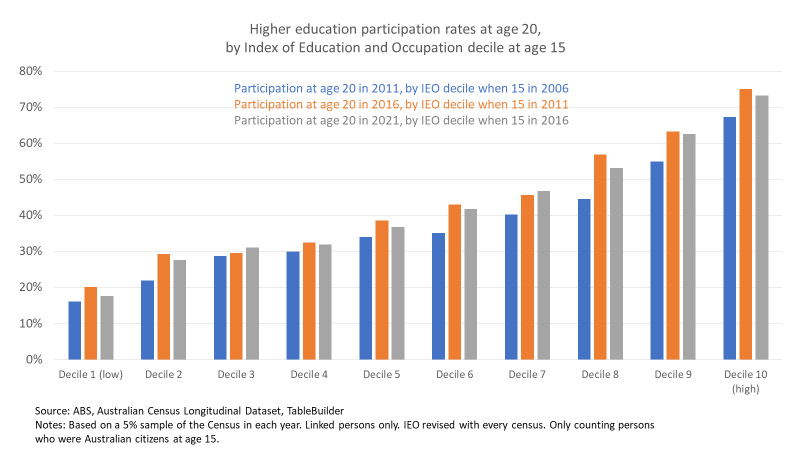
One issue with measuring trends in low SES enrolments is correctly identifying low SES students. In higher education statistics a person is low SES if from an area in the lowest 25% by the ABS Index of Education and Occupation. As charts below will show, this IEO geographic proxy shows a distinctive lowest 10% for higher education participation. Above that, however, we see modest participation and attainment increments between deciles 2-6, with differences then speeding up to a distinctive top 20%.
The participation rate similarity between deciles 2-6 makes the current low SES definition unsuitable for funding purposes, but a reasonable rough guide to overall trends. Because deciles 2-6 are sociologically similar, they probably respond in similar ways to economic, educational and policy trends affecting higher education enrolments.
In his speech, the minister referred to an enrolment share metric, low SES students/all domestic students. That’s administratively convenient but analytically weak, as low SES results depend as much as movements in middle and high SES as low SES enrolments. Participation rates are better measures, low SES higher education students/low SES population.
The chart below uses census longitudinal data for school leavers, taking as their SES the IEO ranking of where they lived when they were 15 years old, to better capture the social context of their secondary school years. The orange bars show that in 2016 all deciles had increased their participation rates since 2011, facilitated by the demand driven funding system. But in 2021, shown in grey bars, the participation rate in most deciles was lower than in 2016. There may be some statistical noise. This dataset takes a 5% sample of the census and my results omit unlinked census records – meaning the ABS could not track the same person from census to census or the necessary data was missing. But other data reported in this post confirms that the overall trend is real, even if some decile results are not 100% accurate.
Applications and enrolments
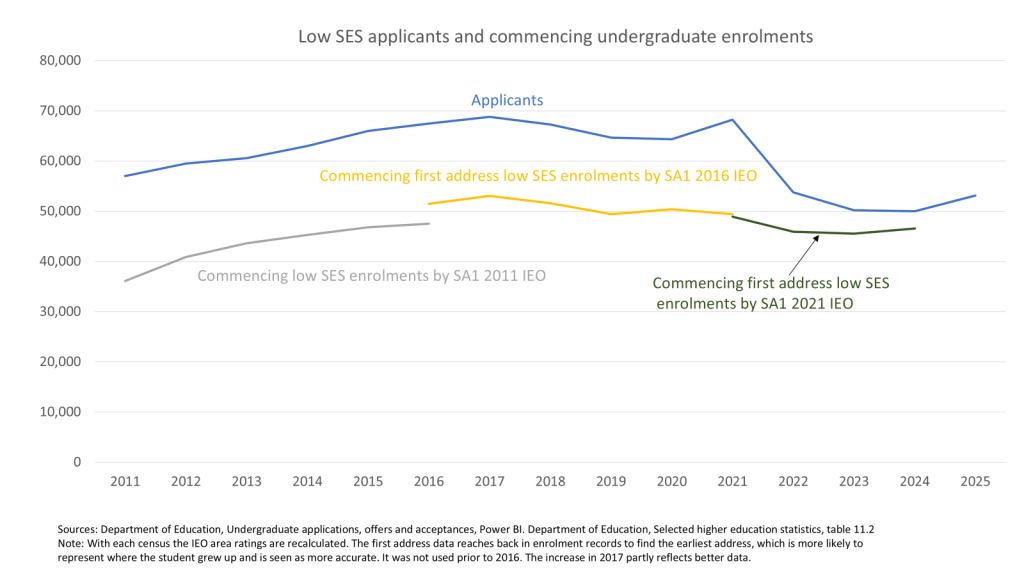
Switching to administrative data using the lowest 25% definition, the chart below shows that low SES applications and commencing enrolments increased between 2011 and 2017, consistent with the increased participation showing in the chart above. If we ignore the COVID spike in 2021, applications and commencing enrolments decline before stabilisation and then improvement in recent years.
In his UA speech, the minister blamed the Coalition for terminating the demand driven funding system at the end of 2017. That cannot have helped enrolments, but a supply-side change would not have any short-term effect on applications. Post-COVID many universities have, in any case, been unable to use all their allocated funding. Reduced enrolments reflect limited demand rather than constrained supply.
Mature age demand
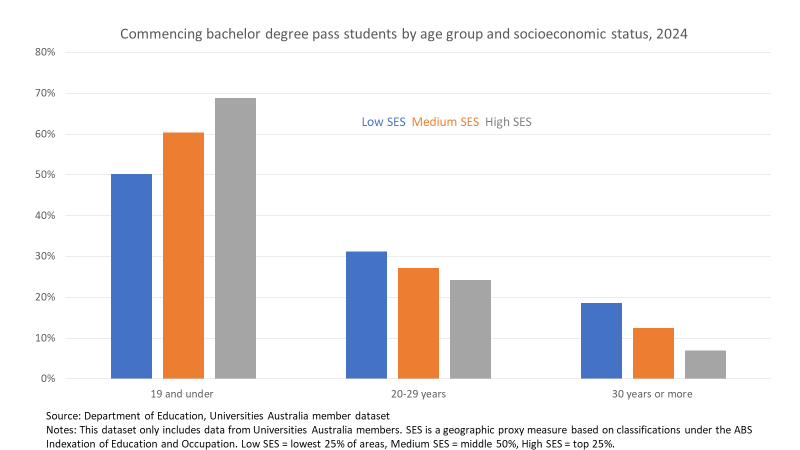
I’ve argued elsewhere that the soft higher education demand in recent years has primarily, although not entirely, been driven by fewer older applicants and students. Historically low SES students have older average ages than medium or high SES students, which remained true in 2024 (chart below).
In my mature-age analysis I proposed two theories about why numbers were down. One was higher education’s counter-cyclical relationship with the labour market – when jobs are hard to find enrolments go up, when jobs are easy to find enrolments go down. Intuitively this helps explain fewer low SES mature age enrolments. Money in the bank now from a full-time job is more attractive than speculative financial benefits from a degree sometime in the future.
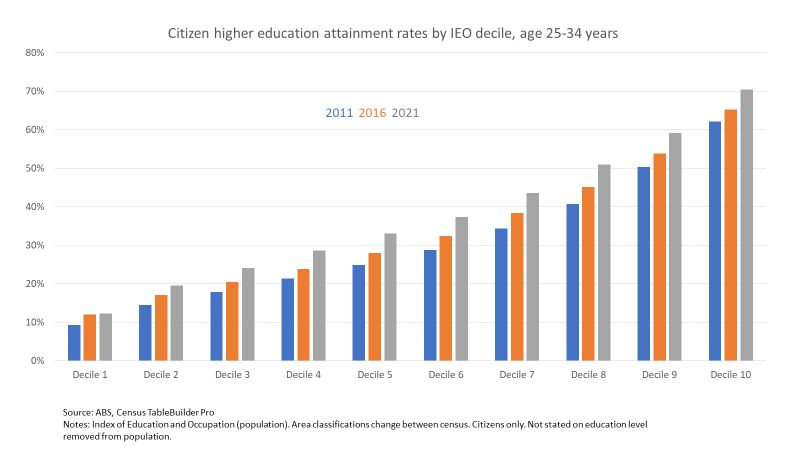
My second theory was that the increased enrolments in the 2010s meant fewer 20- and 30-somethings in the 2020s still seeking a university degree. The chart below shows that across all Index of Education and Occupation deciles attainment increased between the census years for the 25 to 34 year old age group. Attainment rates are still low, however, in deciles one to four (noting that attainment rates are below participation levels for young adults; graduates move to areas with more amenity and suitable jobs).
Both these theories are largely benign explanations of the low SES trend.
School leaver demand
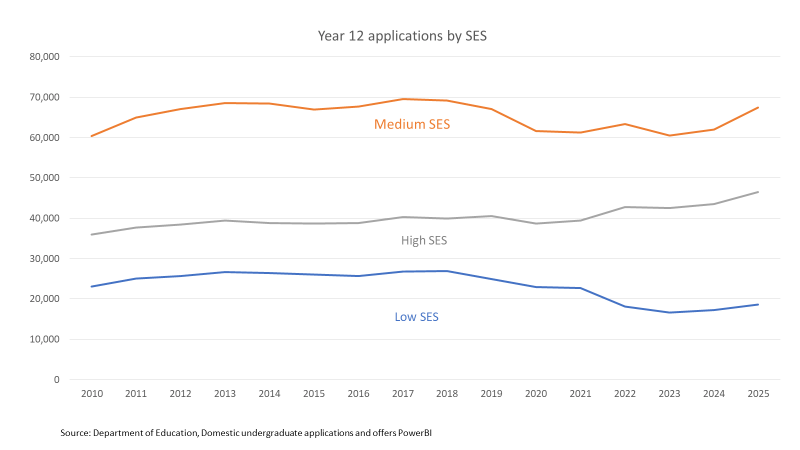
But the decline in low SES applications was not restricted to mature-age applicants. Low SES school leaver applicants fell significantly after 2018. Medium SES applications – which following my argument above has large populations of people sociologically similar to the official low SES group, other than lowest decile – followed a parallel pattern. Only high SES applications showed resilience or growth prior to the general 2025 uplift.
Population
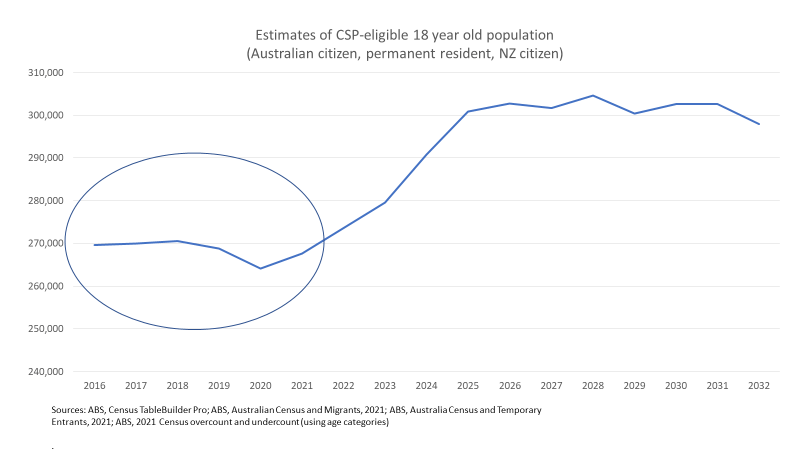
A post-2017 fall in applications of this scale points to population factors. A demographic dip in the period of interest (chart below) followed by an increase helps explain the general trend in school leaver applications.
The official measure of low SES is based on the IEO rating of the 15-64 year old population. But age sub-groups could show different SES patterns to the overall formula of lowest 25% = low SES, middle 50% = medium SES, top 25% = high SES.
The publicly available version of IEO data offers decile measures. I redefined the groups as lowest 30% = low SES, middle 40% = medium SES, top 30% = high SES. I put an Australian citizen filter on the data; I am unsure if the official statistics also do this. At ages 15, 16, 17 and 18, in each of the 2016 and 2021 Censuses, I find that the IEO population distributions between SES categories are close to the shares we would expect, with a slight over-representation of medium SES. This does not seem to be the problem.
While the IEO preserves relative measures of SES, the underlying population categories are moving. Historical growth in post-secondary education means that today’s parents are more educated than parents in past generations. The number of parents of Year 9 students who did not finish school trended significantly down over the relevant time period, while Year 12 only was slightly down over the same years. The numbers of parents with post-secondary education, particularly a bachelor degree or above, has increased significantly – aligning with the high SES school leaver application figures.
Year 12
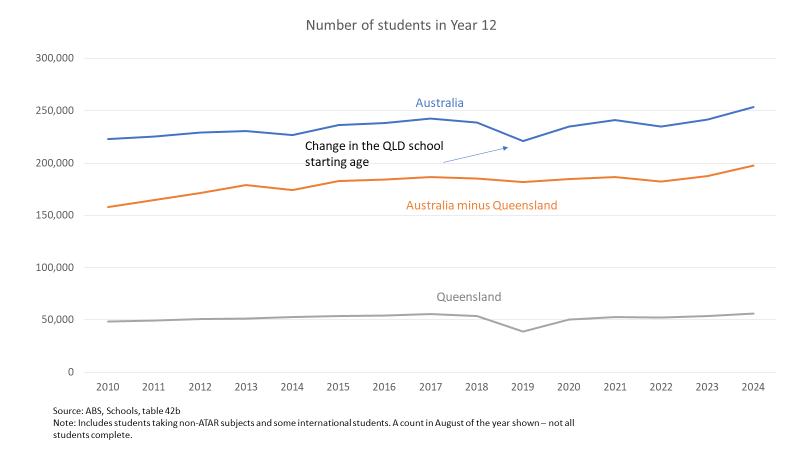
Consistent with the demographic estimates, the number of Year 12 students fell after 2017. After taking out Queensland, which had school starting age changes in the 2000s flowing through, the drop is about 4,900 between the peak in 2017 and 2019. But the decline in low SES school leaver applications is too large for movements in total Year 12 enrolments to be the explanation.
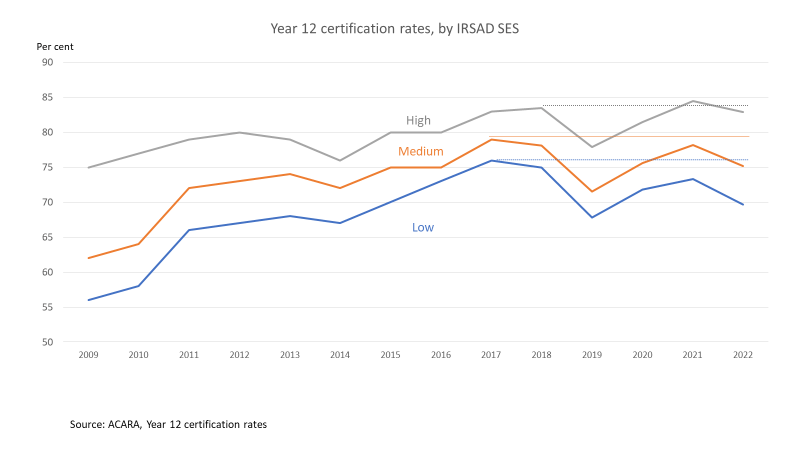
Many media stories over recent years report declining school retention. If this disproportionately affects low SES students it might help explain the applications trend, despite aggregate Year 12 numbers not changing dramatically. Unfortunately school retention data is low quality. ACARA reports a Year 12 certification rate (successful completion of Year 12) by SES. Its population figure is ‘an estimate of a single year age group which could have attended Year 12 that year, calculated as the estimated resident population (ERP) aged 15 to 19 divided by five.’ When demographics are shifting numbers – for example baby boom figures affecting 15 and 16 year old numbers but not older groups – the denominator is only semi-reliable.
Year 12 certification SES data uses the ABS Index of Relative Socio-Economic Disadvantage. Compared to the IEO used in higher education, IRSAD puts more emphasis on material deprivation and less on education. The IRSAD Year 12 certification SES is on the division of lowest 30% = low SES, middle 40% = medium SES, top 30% = high SES.
There is a Queensland problem in this data as well, so add another caveat and don’t pay too much attention to 2019.
With all these data warnings, the Year 12 certification trends broadly align with the higher education trends. Increased low SES Year 12 certification rates up to 2017 provided a foundation for more low SES students up to 2017. The decline in low SES certification rates after 2017 is consistent with the subsequent decrease in low SES enrolments. Up to 2022 (the latest data I can find) low and medium SES retention rates had not recovered to 2017 levels while high SES rates had.
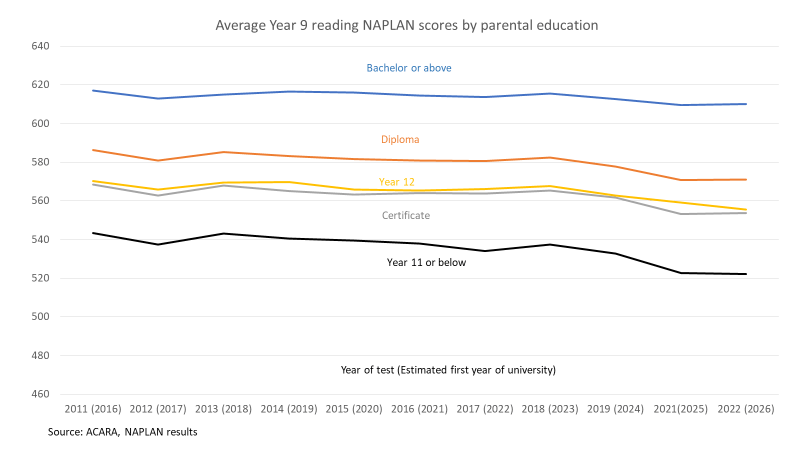
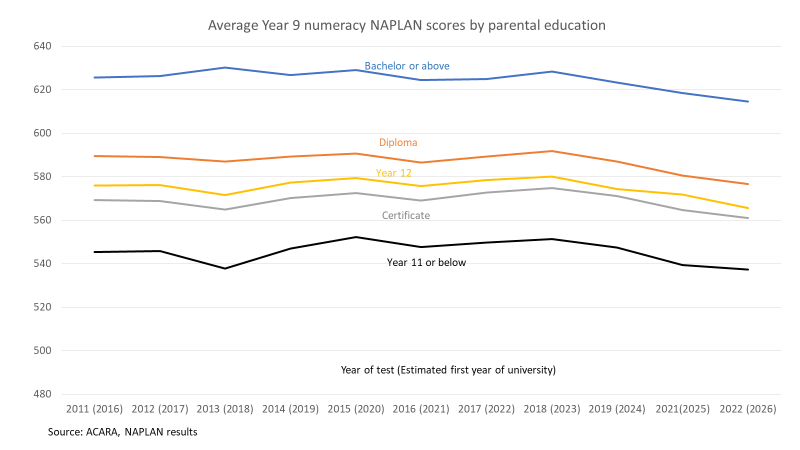
Declining academic performance
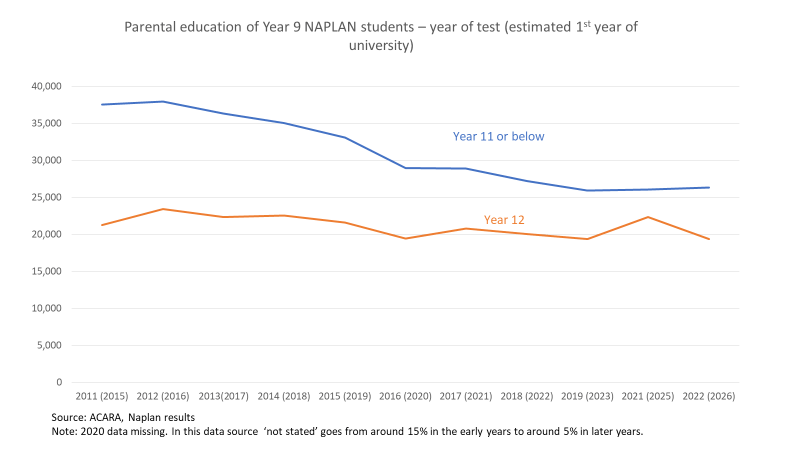
Why are Year 12 numbers down? If NAPLAN scores are a guide, recent school leaver cohorts suffer from declining academic performance across all SES categories, as measured by parental education. But possibly for larger numbers of school students whose parents have school, certificate or diploma education their academic achievement tipped below the point where university is attractive or feasible. ATAR is a relative measure that can hide deteriorating absolute levels of performance.
Vocational education
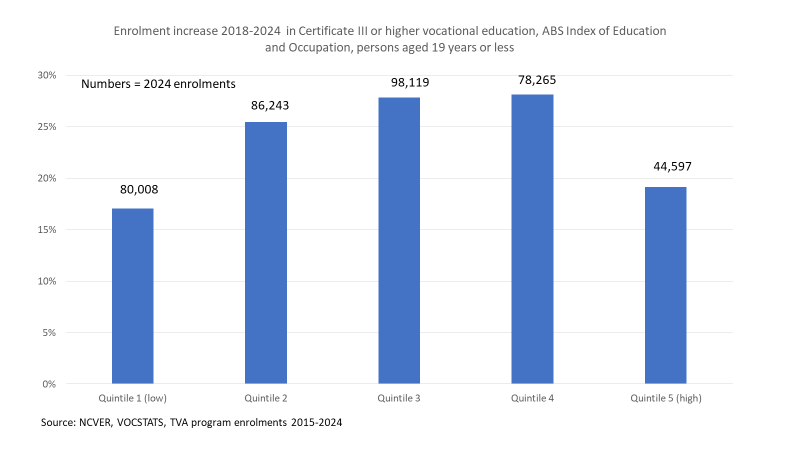
I noted in a post about overall higher education applications that vocational demand has been strong. It was broad-based across the IEO groups, with the data in quintiles this time. The lowest quintile had the smallest percentage growth 2018-2024, up 17% – but much better than the 36% decline in low SES higher education applications over the same timeframe. In absolute terms, the lowest quintile had more enrolments than quintiles 4 or 5.
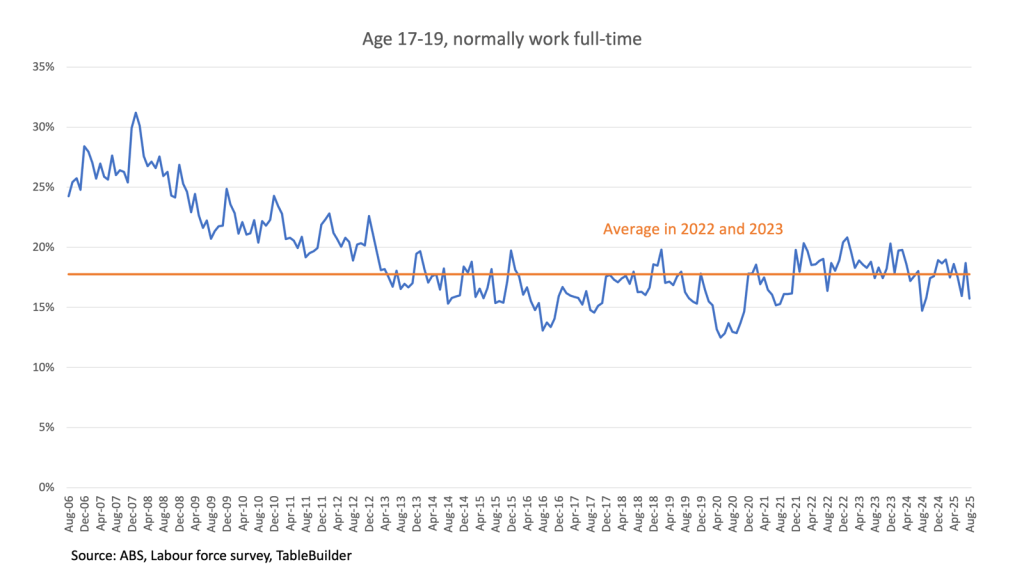
Youth employment
Post-COVID youth full-time employment rebounded, which would help explain why some school leavers choose work over study. But for low and medium SES school leavers – 75% of the cohort – the downward trend starts pre-COVID. There is a small increase in full-time employment pre-COVID but not, I think, big enough to be more than a minor explanation for the observed higher education trends.
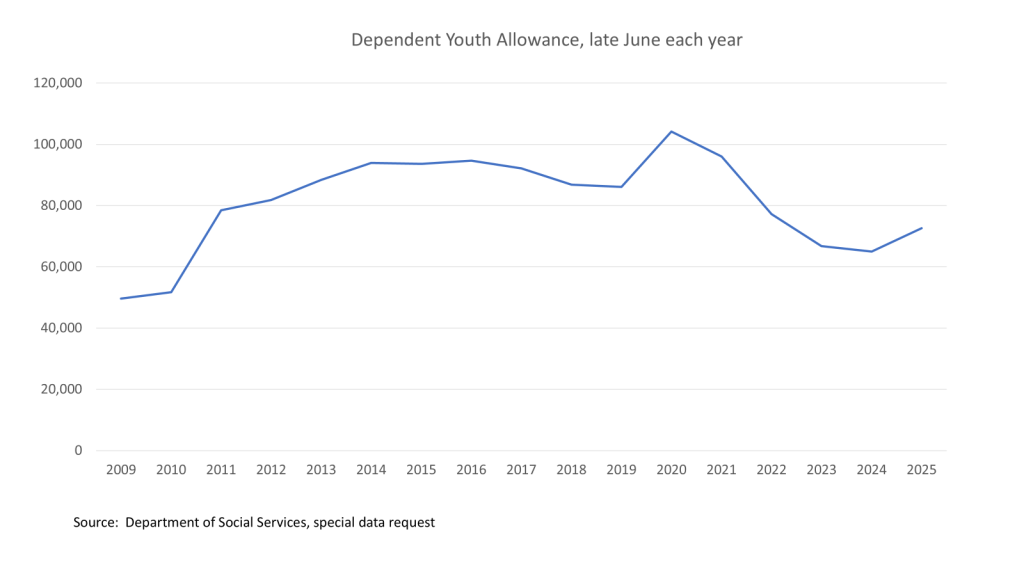
Income support
As I wrote in a post last year, student income support numbers declined from the mid-2010s to 2024, except for a COVID spike. The chart below shows only those higher education students on ‘dependent’ Youth Allowance, who met a stringent parental income test.
In this period a policy change made YA less attractive, converting the Start-up Scholarship to a loan in 2016 – effectively reducing income support by $2000 a year. Possibly this made it harder for low SES school leavers to go to university (although they could still borrow the money).
Another possibility is that fewer potential students had parents who could satisfy the income test. The most straightforward way to satisfy this test is having parents on income support. The 2020 spike is interesting for this reason – it coincides with a major increase in potential parents, people aged 45-64 years, receiving JobSeeker. Post-COVID a strong labour market probably meant fewer parents of potential students on income support and more earning wages that exceeded the YA parental income test.
This strong labour market also made student-suitable work easier to find and boosted the median student wage, making it more financially attractive than YA.
There is a chicken and egg problem here. YA trends may reflect a low SES enrolment decline happening for other reasons, or it may be an independent factor reducing demand for higher education, or a mix of both. The 2025 YA recipient increase is consistent with the 2025 increase in low SES applications. In the absence of any recent changesto YA policy, it is one data point in favour of YA trends being driven by changes in the underlying population.
Conclusion
To summarise, four benign and/or temporary factors contributed to reduced low SES demand for higher education:
- Past attainment in mature age groups
- Alternatives in the labour market
- A demographic dip
- Increased vocational education enrolments
There is one clearly negative factor, declining school performance and retention, and one possibly negative factor, student income support availability.
Demographically we are back in a growth phase, which probably explains the increase in low SES school leaver applications in 2025. More recently school retention may have improved slightly. Conditions are in place for growth in low SES school leaver applications and enrolments. But I doubt the academic fundamentals can support the low SES enrolment share increases that ATEC will demand.
