What happens if a university needs bailing out?

University finances have been in the news this year. As the travel ban on Chinese students was announced some very big financial costs were estimated – since moderated due to the third-country quarantine exception, but still estimated to be well over $1 billion, at least in temporary cash flow issues.

In worst-case COVID-19 scenarios there would be travel bans from many international student source countries, along with campus closures that could require refunds or compensating classes for affected domestic and international students.

While I doubt the worst-case scenario will become reality, the ‘rivers of gold’ era (as Simon Birmingham once described it) for university revenue is over.

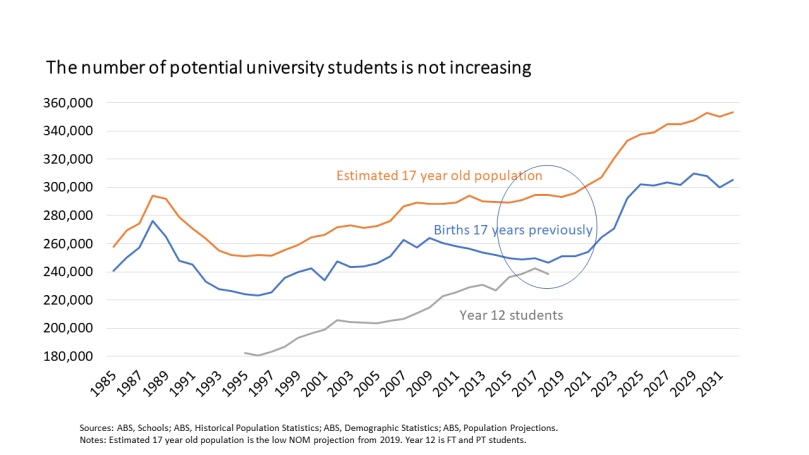
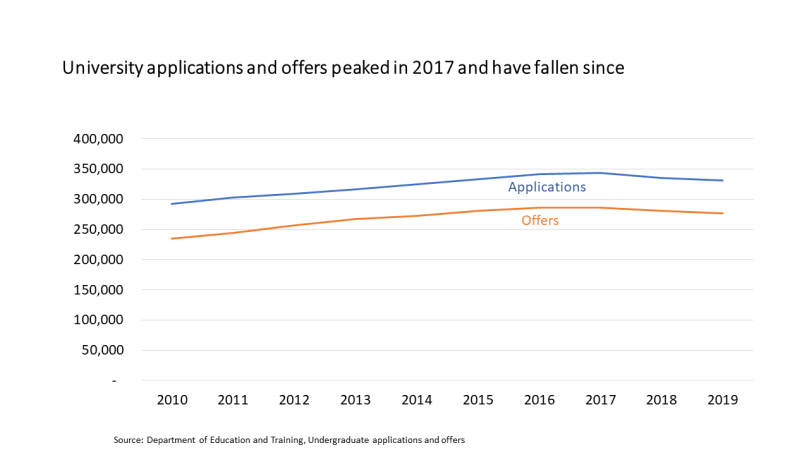
Even before COVID-19 international student demand seemed to be softening, while remaining high by historical standards.

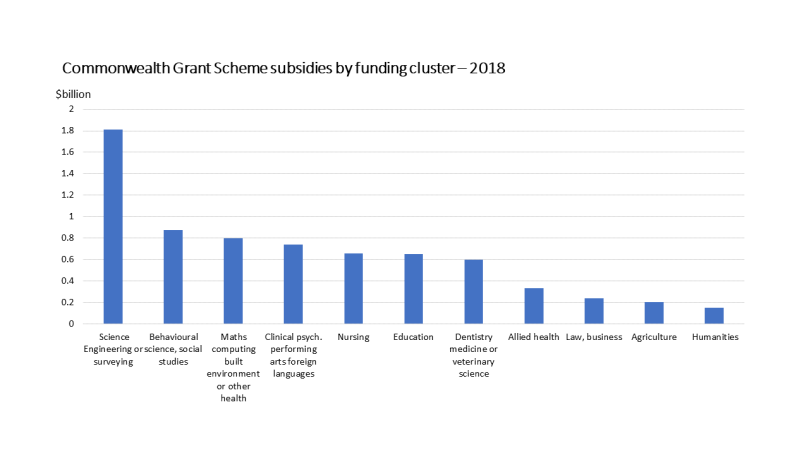
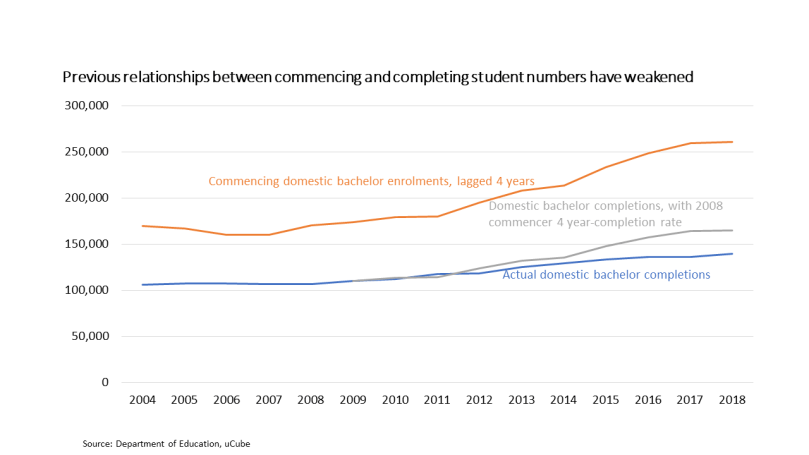
On top of this, all public universities are dealing with a decline in the real value of their bachelor-degree student funding, and some are struggling to maintain domestic student numbers due to soft demand.

Cutbacks have been reported at many universities including Wollongong, La Trobe, Sydney, Macquarie, Monash, and in the last day the University of Tasmania.

Fortunately, the universities that are most exposed to the China market are relatively wealthy. They should be able to deal with short-term liquidity issues from a mix of reduced and delayed spending, drawing on reserves and perhaps bank borrowing. But what if a university faces more serious difficulties?Read More »

How should we measure SES for research students?

Last week the Department of Education issued a report on equity students enrolled in research higher degree programs. As those who have read my work over the years know, I think we have significant conceptual and empirical problems in measuring socioeconomic status in higher education. And these are even more significant for higher degree students than they are for undergraduates.

What this means is that even though the report’s overall conclusion, that high SES students are ‘over-represented’ in research degrees, must be true based on other empirical evidence and theory, its statement that ‘this data should … be used with caution’ is a warning that should be heeded.

Problem One: We are only using a geographic proxy indicator for SES, the ABS Index of Education and Occupation. A person is classified as low SES if they live in an area in which the population has relatively low levels of education and relatively high levels of people who are unemployed or work in lower-skill occupations.  But people with high levels of education and with high skill jobs live in otherwise low SES areas, and vice-versa.

Problem Two: We define as low SES people living in the lowest 25 per cent of areas by the Index of Education and Occupation. That is too small a share – the next quartile up is sociologically similar.

Problem Three: For research students, are we interested in their current socioeconomic status or their background? Regardless of their background, if they already have a degree (which they almost certainly do if they are in a research degree) and work in a professional job, as is quite likely to to be the case, then they are not going to be classed as low SES by the standard bureaucratic measures. And if they have moved to study and/or to be closer to professional job markets, then they will probably live in high SES areas.Read More »

Teaching public funding is skewed to STEM and health-related courses

With the government now publishing data on students by funding cluster we can get a clearer idea of where Commonwealth Grant Scheme money goes.

My calculations are for 2018, and based on multiplying equivalent full-time student numbers in Commonwealth supported places by the relevant funding cluster rate. Due to the demand driven funding freeze and some universities over-enrolling allocated places the overall total exceeds what universities were actually paid. However, as it is usually not possible to specifically identify ‘over-enrolled’ students I am going to assume that this does not affect relativities between the clusters.

As the chart below shows the science, engineering and surveying funding cluster is by far the biggest recipient of Commonwealth funds, at $1.8 billion in 2018 (and this is missing the maths and statistics buried in another cluster). The health-related clusters between them received $1.6 billion, and this is also an under-count due to some health courses being in other clusters.

funding cluster spend 2018 (all)

As is the case with public research spending, public tuition subsidies are skewed to STEM and health clusters. They have 32 per cent of EFTSL but 48 per cent of funding. The humanities, which are the subject of much of the controversy around higher education, received the least money of any cluster, $151 million in 2018. This is 2.1 per cent of the total.

However, it should be noted that other subjects typically taught in Arts faculties are in other funding clusters. For example, fields such as politics and sociology are in the second largest funding cluster by dollars (which also includes psychology, social work, and similar fields) and in the fourth largest funding cluster by dollars, which includes foreign languages and media and communications, which despite a recent downward trend has grown significantly over the last decade.

(Last paragraph added after original publication after Twitter commentary.)

How much did the demand driven funding freeze save the government in 2018 (and cost the unis)?

When the funding freeze on university bachelor-degree places was announced in December 2017 there were some big claims made about both how much it would cost the universities and save the government.

But at least in its first year, 2018, its effects were probably smaller than many people (myself included) expected.

I have to first put some caveats around my data, because I am trying to reconstruct what went on from multiple sources. As is often the case, there are discrepancies between the sources on what should be the same number,  such as equivalent full-time student load (EFTSL) or money paid. The main reason for this is that they are revised during the year in question and afterwards. Read More »

Universities with good performance may still miss out on performance funding

Last week the government released more detail about how its university performance funding scheme is to work (in the same week that the re-badged Department of Education, Skills and Employment’s administrative arrangements, showing some very dry bureaucratic humour, listed as one its responsibilities ‘reducing the burden of government regulation’).

Last week’s document confirms that the legal basis of performance funding will change from 2021. As I pointed out last year, at the moment there is performance funding but no performance fund. For 2020, all the government offers is to pay universities a bit more of their demand driven funding entitlements.

If a university’s demand driven entitlements (bachelor-degree EFTSL * the relevant funding cluster rates) don’t reach the performance funding maximum grant (2017 demand driven funding + special deals done since + population-growth based performance-contingent increment) it will not get the performance funding, or will get only part of it. Read More »

What is going on with domestic bachelor-degree completions?

Historically, increases in commencing bachelor-degree students flow through into increased completions in the three to five years afterwards. And initially the demand driven boom of 2009 to 2014 looked like previous patterns. The increased commencing cohort sizes, shown lagged by four years by the orange line in the chart below, are evident in larger completing cohorts between 2012 and 2015 (blue line). 4 year lagged commencers and completors

But then growth in completions slows to a near stall in 2017, which had 0.3% more completions than in 2016. In 2018 there were 2.2% more completions than in 2017, but this still looks surprisingly low. If there had been the same relationship between completions and commencements four years later in 2018 as there had been in 2008, nearly 26,000 more people would have finished their degrees in 2018 (grey line in the chart above). Read More »

The hardline voluntary student union option, and other things from the latest release of Cabinet papers

As in 2019, this year’s 1 January release of old Cabinet papers reveals new details about the Coalition’s internal debates about higher education. However, this time I am less of a disinterested observer, as the 1998 and 1999 papers made public today include the time when I was higher education adviser to the then education minister, Dr David Kemp.

There are several topics discussed – the government’s response to the West review of higher education, voluntary student unionism, and the 1999-2000 Budget. For me the common thread, apart from the portfolio area, is Dr Kemp’s efforts to maintain, despite competing fiscal and political pressures,  the policy and political conditions needed for an intellectually coherent higher education policy. He was headed to a major higher education reform Cabinet submission later in 1999 (not in this official release, but it was leaked twenty years ago).

When the Howard government came to office in 1996 its first priority was bringing the Budget back into balance. In higher education, this led to cuts to per student subsidies in higher education with offsetting increases in HECS charges, cuts to student places, and a reduced income threshold for repaying HECS debt.

As I have observed before, often the Coalition ends up with not so much a higher education policy as a fiscal policy with implications for higher education. But in 1996 they knew that quickly-made budget-driven decisions were not the basis of long-term policy, and commissioned a broader examination of higher education policy, which turned into the West review. (One of my tasks as a ministerial adviser was liaising with its chair, Roderick West, a retired school headmaster with no public policy experience. The technocrats were running rings around him, but you have to admire someone who can incorporate quotations from ancient Greeks and Romans into an Australian government policy report, as he did in his chairman’s foreword.)Read More »

Is declining higher education demand a concern?

In the last couple of years demand for higher education has trended down, with enrolments falling slightly in 2018 compared to 2017. This post explores some reasons why this might be happening.

Demographic trends are always important to enrolments and participation rates.  Unfortunately no data source tells us in total or by age how many people meet the eligibility criteria for a Commonwealth-supported place.

The size of the birth cohort has a significant influence, but under-counts eligible persons due to migration. With 22 per cent of domestic students born overseas migration is important to demand. ABS demographic data includes migrants, but because of long-term temporary residents over-states how many people are eligible for a CSP.

As universities generally require students to have completed Year 12, final year of school enrolments are also a guide to potential demand. However, this is also an imperfect indicator, due to temporary migrants and not all Year 12 students taking subjects that qualify them for university entry.

With all these caveats, the chart below shows that none of the potential population indicators suggest that, holding participation rates constant, that demand for higher education should be up in aggregate terms. The (temporarily) falling size of the birth cohort and the slight dip in Year 12 students would suggest that demand might trend down.

potential uni students

Read More »

Has the university funding freeze caused commencing enrolments to fall?

The 2018 higher education enrolment data, published yesterday (yes, it should be released much earlier than late October), showed a rare fall in public university domestic commencing bachelor degree students. Both a headcount and full-time equivalent count show a decline of about 0.8 per cent compared to 2017.

2018 was also the first year post the demand driven system, the practical implication of which was that universities would not be paid Commonwealth contributions for enrolling additional students. Indeed, there is a financial incentive to let the number of student places fall.

So is this cause and effect, with changed funding rules causing enrolments to decline? I have no special insight into the strategic decisions of universities, but overall this trend looks to be driven by weak demand more than an unwillingness to supply student places.

As the chart below shows, applications trended down in 2018 and 2019 and offers (willingness to supply) followed this trend. Offer rates were stable: 83.2 per cent in 2017, 83.8 per cent in 2018, and 83.6 per cent in 2019. If universities were actively trying to reduce numbers we might expect offer rates to go down, but this isn’t happening.

applications down 2019

Read More »

The popularity of online self-education

A couple of weeks ago I posted on the surprising apparent decline of reskilling and retraining. Mature-age undergraduate, postgraduate, vocational qualification, ABS work-related training, and ATO self-education expenses have all trended down in recent years. These trends did not seem consistent with the oft-repeated claims of workplace change and the need to reskill and retrain.

Especially on LinkedIn, much of the reaction to the post suggested that this was due to online self-education as a substitute for credentialed and uncredentialed courses and training. While I haven’t found any time series data on how online self-education  has grown, I am persuaded that this must be a significant part of the explanation.

In a recent Pearson global survey of learners, employed respondents who required further training were asked how they did it. In Australia, organised courses or training are still more widely used than online self-education. But a third of the sample had used this method (chart below).

use Pearson

Read More »