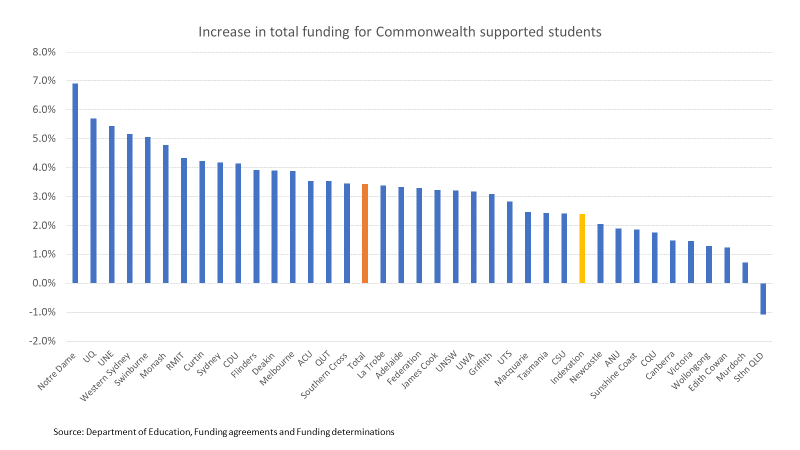
This post looks at estimated 2026 funding for Commonwealth supported students in public universities. Compared to my earlier post on block grants it adds public funding for medical students, demand driven funding for Indigenous students in bachelor degrees, and student contribution revenue. Total expected public university revenue for Commonwealth supported students, as of February 2026, is $15.5 billion. This is 3.4% more than in 2025.
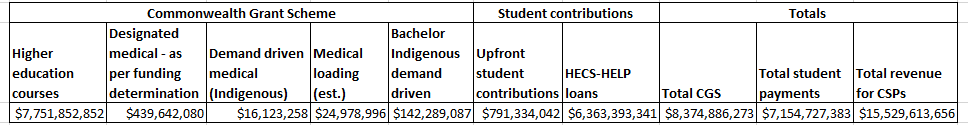
The 2026 figures by university can be downloaded here.
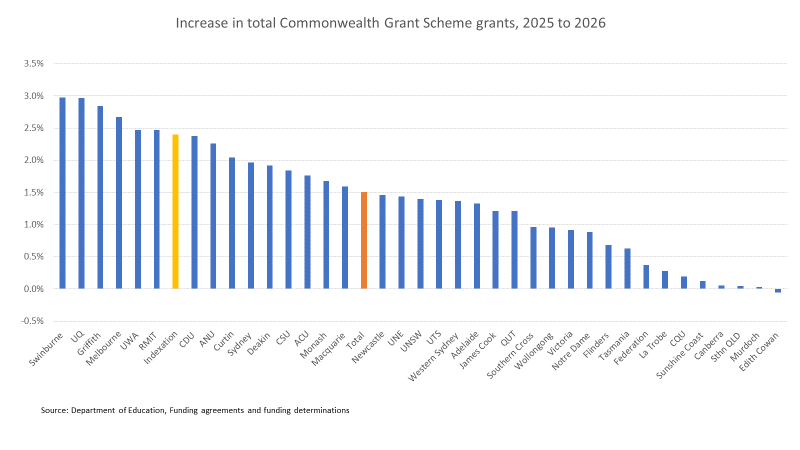
Commonwealth Grant Scheme
Adding medical and Indigenous places to the block grant ‘higher education courses’ figures, which were discussed in the earlier post, significantly increases Commonwealth Grant Scheme (CGS) totals for some universities. But it does not greatly change overall conclusions about trends in the CGS. CGS funding is down in real terms, with an overall increase of 1.5%, compared to the previous CPI increase policy, which would have delivered a 2.4% increase. Only six universities receive a 2026 CGS increase of 2.4% or more on 2025.
From publicly available information I can partly explain the reasons for university-level changes. As noted in the earlier post some ad hoc places programs (e.g. the equity 20,000 places) are being phased out. The government is not indexing higher education courses grants of universities that were not fully using their ‘higher education courses’ allocation. Seven universities expect to earn less in 2026 than in 2025 from the Indigenous bachelor degree demand driven program. Some universities have increased funding for nuclear submarine places, $15.4 million in total.
One university shows a 2026 CGS decline on 2025, but if this happens the Transition Funding Floor Guarantee will return it to a neutral position.
Since I wrote the block grant post I have been informed of two other factors affecting CGS figures that are not yet shown in my data sources, the funding agreements and the funding determinations. First, current allocations do not include the 100 new medical places announced last November. That will add $3.2 million to the ‘designated medical’ category. Second, there is not yet any money converting some over-enrolments (i.e. student contribution only places) to fully funded places. If this turns out to be the $50 million mentioned in briefings to universities, over-enrolment money and the extra medical places will lift the 2026 total CGS increase on 2025 to 2.2%.
Although most universities are, in CPI adjusted terms, facing lower CGS funding for 2026 their total subsidies for Commonwealth supported students may nevertheless go up. One possible reason for CGS stinginess is that the government is increasing expenditure on equity students through needs based funding. In future needs based funding will be a CGS sub-program. As an interim measure, until the necessarily legislation is passed, the government is repurposing the non-CGS statutory basis of pre-2026 equity programs for needs based funding.
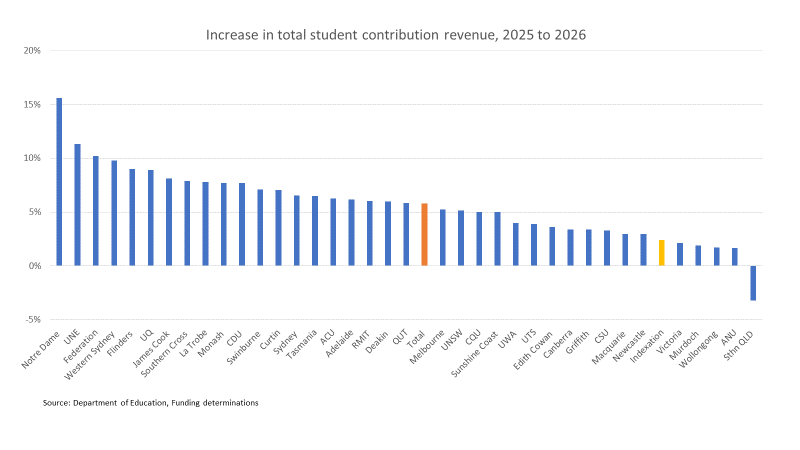
Student contributions
While the CGS funding figures paint a picture of a sector in, at best, a state of Commonwealth supported places stasis, the student contribution figures look rather different. These are based on estimates provided by universities, with anticipated overall student contribution revenue growth of 5.8% in 2026 on 2025, with 13 universities forecasting growth of 7% or more.
There are several reasons why universities might forecast student contribution revenues above the 2.4% indexation of student contribution charges. These are:
- Replacement of pre-JRG enrolments paying grandfathered student contribution rates with post-2020 students on higher JRG rates
- Net movement of enrolments from low to high student contribution fields of education
- Enrolling more students
I would need some persuading, however, to deem all these figures plausible. Nine of the thirteen universities estimating growth of 7% or more have lower projected CGS growth than the 1.5% across the sector. Many of them were under-enrolled in the last year for which we have figures, 2023 (with ‘under-enrolment’ meaning that the student places they delivered were valued at less than their ‘higher education courses’ and/or ‘designated courses’ funding agreement allocations).
I have no inside information on how these figures were derived, but possibly we are seeing the complicated politics of under-enrolment and over-enrolment playing out.
To recap on this, the government wants greater control of enrolments. It wants fewer under-enrolled universities. It is not indexing the grants of under-enrolled universities. It is making its funding guarantee less generous. Under-enrolled universities will have received the message and, perhaps, offered optimistic enrolment predictions.
The government also wants to restrict over-enrolments, despite relying on them for claimed growth in student places. Under current law, the government cannot stop over-enrolments. But the threat of future laws, and perhaps the incentive of CGS payments for current over-enrolments, have let the government negotiate a so-called ‘glidepath’, for over-enrolled universities to moderate commencing students from 2026 to get them within a 2% to 5% band of their allocated number of places by 2031.
Other information I have received suggests the over-enrolment crackdown has not, to date, been as severe as I feared, with only two universities held to lower commencing numbers in 2026 compared to 2025 (although universities may have been held to lower numbers than they would have otherwise taken). There will also be a re-evaluation this month of where 2026 actual enrolments are sitting.
While the student contribution estimates of some universities may be over-optimistic is is clear that, apart from some extra medical places, any growth in student places will not be driven by increases in CGS funds, which will fall in real terms. It will come from a mix of better utilisation of already-allocated CGS money and over-enrolments.
Overall funding
Overall funding trends by university depend heavily on the credibility of the student contribution estimates. As noted I am sceptical in some cases. But FWIW the chart below shows the estimates.