Australia’s higher education teaching funding system is primarily based on subjects rather than students. Subjects taken are converted into ‘equivalent full-time student load’ (EFTSL), the amount of study a full-time student does in an academic year. The funding rate per EFTSL varies by field of education, assuming that subject characteristics drive costs.
Various supplementary programs calculate funding on headcount equity students, but with trivial resources compared to the subject-driven funding programs, the Commonwealth Grant Scheme and HELP.
Funding on headcount?
One interesting idea in submissions to the Universities Accord review, especially suggested by regional universities, was to base more funding on the student. For part-time study one EFTSL could be two or more individual students. While their combined classroom time matches one full-time student, a student with 50 per cent of an EFTSL could put similar or even greater demands on other university services as a student at 100 per cent of an EFTSL.
In RUN’s submission they report a member university’s finding that, on average, their part-time students utilised eleven services compared to five for full-time students.
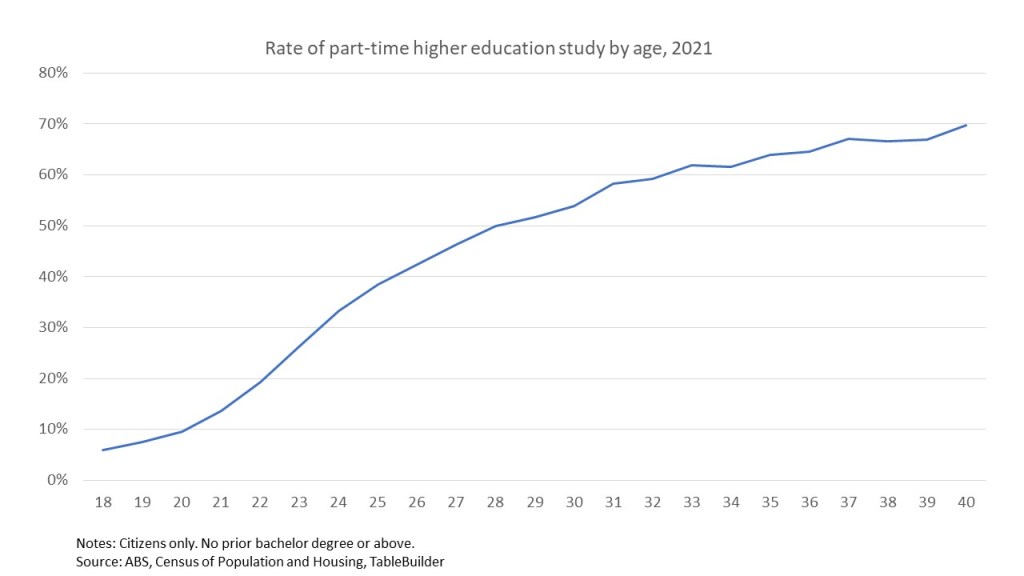
Older students are more likely to enrol part-time (chart below). Given the high rates of upper ATAR students going to university soon after school older first-time students must disproportionately be people with weaker school results. They plausibly have above-average needs for academic support to complete their courses successfully.
Loadings for higher need students?
While not directly making the EFTSL/headcount distinction, the Universities Accord interim report raises the possibility of using loadings ‘to reflect differential costs of adequately supporting different student cohorts’ (p. 134). The Schooling Resource Standard is given as an example. It combines a base rate for all students with loadings for students with disabilities, Indigenous students, low SES students, regional and remote students and small schools.
The Deloitte Access Economic cost studies, on which current funding rates are based, include support costs but do not itemise them in the published reports. However they find that regional universities have higher per student costs, something also reported by other cost research. Limited opportunities for economies of scale are one reason for this, but on average regional university students are more resource intensive. A fixed pool of regional loading of $80 million partly compensates for this, but it works out at less than $400 a student, compared to average CGS plus HELP funding ranging from $16,300 to $40,000 per EFTSL.
In principle funding partially based on student characteristics seems worth considering. The current field of education funding rates are based on the idea that some subjects, due to their teaching methods and other characteristics, are more expensive to teach. It is not a big conceptual leap to say that some student types are more expensive to teach.
How would costs be assessed?
The government could commission research on costs by student characteristics, perhaps based on existing but unpublished data. But one general problem with cost research to date is its descriptive rather than normative basis. We are interested in student needs based funding partly because some student groups have a high risk of not completing their courses – suggesting that whatever we are doing now is not enough. While more money will not automatically convert to greater student success, multiple interactions with university services adds costs, as does the one-to-one or small group attention that may be needed.
A different approach to costing is necessary, perhaps focusing on the practices of universities with relatively good outcomes for higher-risk students.
How would funding be allocated?
Given the interim report’s equity focus, shared by the Schooling Resource Standard model, equity student numbers could be used to allocate funding. But I am not sure that this is the right approach.
Many problems faced by equity students are not inherently linked to their defining characteristic. They are just more common. Insufficient academic preparation, for example, is general feature of mass higher education. The chart below, based on applications data for the 2021 academic year, shows low SES students with ATAR profiles skewed to the lower end, but also that low ATARs are found across the SES spectrum. Academic preparation issues will become more prevalent across SES levels with an Accord attainment target that implies that everyone with an ATAR of 45 or above should go to university.

A loading based on an academic preparation indicator such as ATAR, or admission based on prior VET, an enabling course or other proven risk indicators would directly target one significant barrier to success. Unlike some other ‘barriers’ to higher education participation and attainment, this one is part of the higher education sector’s core business, which they can reasonably be expected to do something about.
Student locations and equity indicators
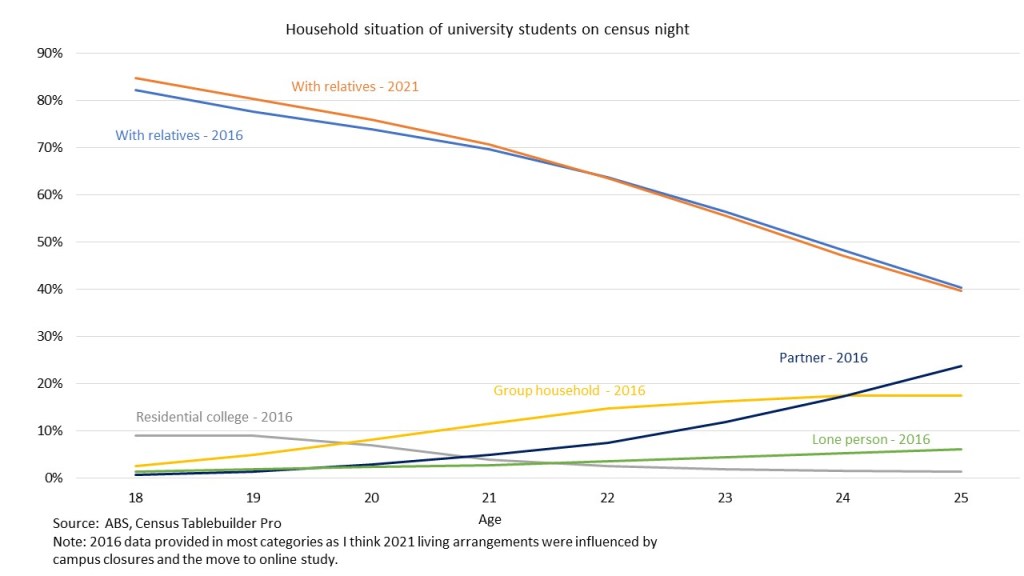
A loading based on academic preparation rather than equity indicators would also help manage the weaknesses and biases in current equity indicators. Of the four priority equity groups – low SES, regional, Indigenous and disability – all but the last have a strong geographic component, low SES and regional by definition and Indigenous by population distribution. Combined with the strong propensity of Australian undergraduates to attend a university near their home, seen in the chart below, this means that institutional equity ‘performance’, as measured by enrolments, is heavily influenced by a university’s location.
The low SES indicator, based on a living in an area classified in the lowest 25 per cent by the ABS Index of Education and Occupation, is a particular problem. It’s known to misclassify individuals. I hear the Department is not using the oldest available student data to get the best individual classification. Because the IEO has a circular element to it – the number of university students is included in the ABS formula – students who move closer to their university end up in a high IEO decile.
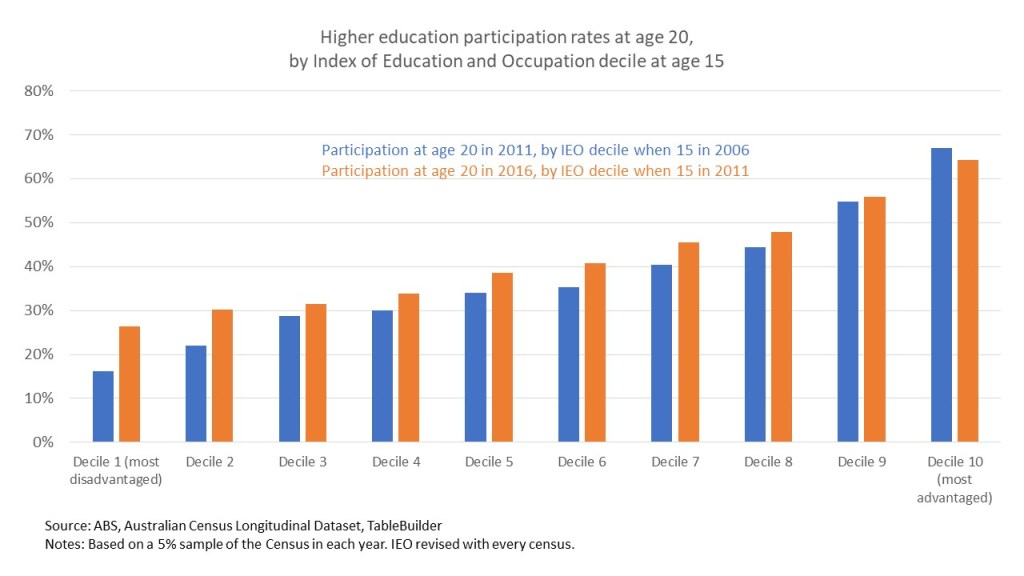
The 25th percentile cut-off also means that similar students are classified differently. I’m waiting for the 2021 census longitudinal data to update the chart below, but reaching five years back to the previous census gives a more reliable guide to the SES level of the community in which students grew up.
The 25th percentile falls between deciles two and three (the data source does not offer quartiles), which have very similar participation rates at age 20 in 2016 – 30.3 percent versus 31.4 per cent. The fourth decile is only a little more again – 33.8 per cent. All these figures are very similar to each other while differing significantly from the 55 per cent plus participation rates in deciles nine and ten. But a university with a catchment area dominated by decile three and four areas will look much worse on equity performance than a university with decile one and two catchments, and get much less equity group-based funding.
Part-time study
The analysis reported by RUN found that part-time students used more university services. Part-time study is also the single biggest risk factor for attrition. But should there be a loading for part-time students, over and above the loadings derived from their basis of admission?
I’m not convinced that part-time study is inherently risky. It appears that way because it is a proxy for weaker academic preparation and students with competing work and family time commitments, as the charts below show.
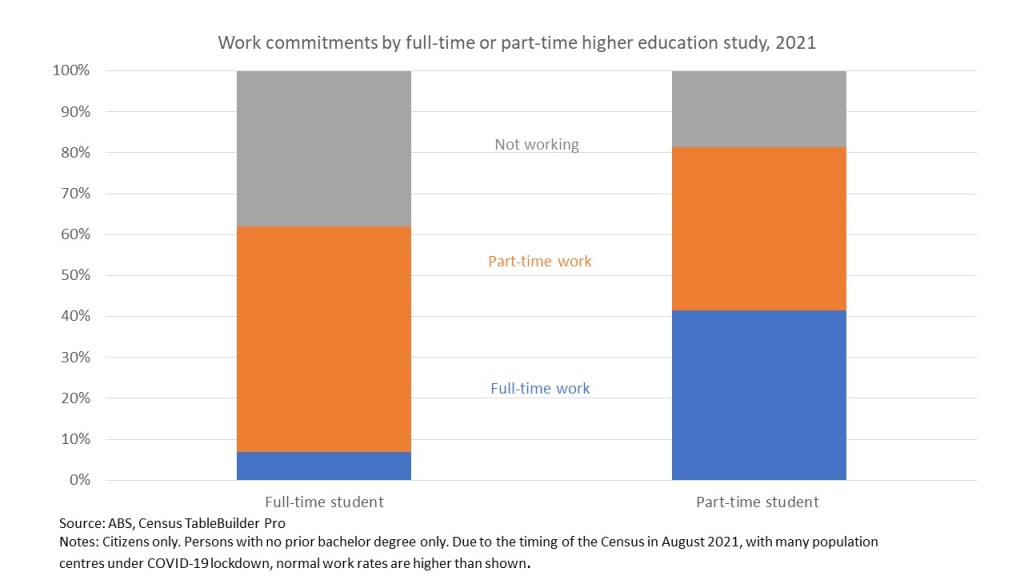

But I’d want to see more analysis of what’s driving part-time study’s link to increased use of university services and how those services are funded.
With this group ‘life getting in the way’ – the work and family commitments in the two charts above – is a significant cause of attrition.
Childcare is an obvious service often provided by universities that part-time students would use. But the government has already substantially increased its direct childcare subsidies. Funding childcare directly rather than via universities helps online as well as on-campus students. It also gives student parents more choice of childcare centre. Similarly, the health services often provided by universities should be principally funded via the health system.
Student income support to help students work less and study more seems to improve completion rates. But again this is a case where the government does and should fund students directly rather than through universities.
Relationship to subject-based funding
There is a role for funding based on headcount student characteristics. But I think EFTSL is still a better indicator of core teaching costs, which plausibly vary by discipline. Transferring large amounts of money currently allocated on an EFTSL/discipline basis to headcount student characteristics would cause significant problems. Universities whose undergraduates are mostly full-time high-ATAR school leavers would receive too little funding.
As with many ideas in the Universities Accord mix, student characteristics-based funding needs extra money to make it practically and politically viable.

‘Universities whose undergraduates are mostly full-time high-ATAR school leavers would receive too little funding.’ What is ‘too little funding’ and why would this be more of a problem than too little funding for universities whose undergraduates are mostly part-time with low-ATARs or other than school leavers?
LikeLike
Fair point, although I am hoping to avoid zero-sum moving of problems around the sector. G8s have economies of scale and students more capable of self-directed learning, but possibly higher staff costs with research-based salaries.
LikeLike
We’re all humans, we should all get the same funding including for tradesman type studies.
That’s what Australia needs. More tradies less unproductive arts students.
LikeLike