Graduate income fluctuations and HELP repayment

Last week I raised concerns about the new HELP repayment system increasing the number of HELP debtors who face very long repayment times or lifetimes of student debt.

The calculations in that post assumed that people maintained their relative income position through their careers – for example that someone who earned the median income at age 25 would still do so at age 35, 45 etc. We know, however, that relative income fluctuates. Family commitments drive movements in and out of full-time work. Careers go better or worse than expected.

Without solving the problems involved in estimating how these changes affect HELP repayments, this post outlines findings on graduate income mobility and labour force status changes.

Movements between income quintiles

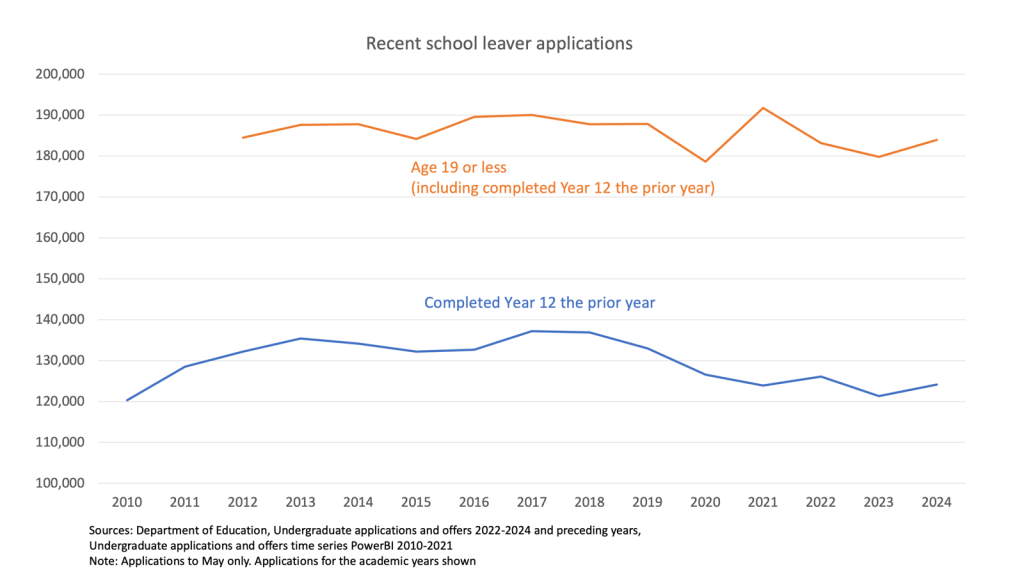
The chart below uses data from a Productivity Commission report on economic mobility. It shows changes in relative income, between five economic quintiles, over a decade since degree completion. The data source is HILDA.

Quintile 5, the highest, shows strong stability. More than 80% of graduates in quintile 5 were still there or in quintile 4 a decade later. The high starting point and following stability may be due to people already doing well in their careers acquiring postgraduate qualifications.

The other quintiles all show significant movement in relative income. Upward movement is expected as we know graduate incomes increase in the years after course completion. Almost half of graduates in the lowest quintile in year one are in the top two quintiles a decade later.

Bu there is also some stability at the lower end. In the two lowest quintiles, 1 and 2, over a quarter remain in those quintiles a decade later. In quintile 3 we see a similar share falling back to quintiles 1 and 2. While some of this is career stagnation, ten years out takes into the ages when women start leaving full-time work to meet family responsibilities.
Read More »
Will the new HELP repayment system make high EMTR problems better or worse?

The new HELP repayment system being legislated this week will move from repaying a % of total income to a % of income above the repayment threshold, a marginal system. In introducing the bill to Parliament, education minister Jason Clare quoted Bruce Chapman on a marginal system: ‘it’s much gentler and much fairer than previously—we should have done it years ago.’

While the new marginal repayment system may be gentler and fairer, it could create more widespread disincentives to working additional hours than the current total income system.

The problem with total income systems

The Universities Accord Final Report, which guides the government’s higher education agenda, criticised the total income repayment as unfair and a deterrent to work.

The underlying problem is that a multi-rate total income repayment system creates multiple threshold ‘cliffs’, income points at which earning $1 more triggers a big increase in student debt repayment. The most extreme cliffs are the lower income levels. Under the current system a debtor whose income reaches the $56,156 first threshold faces an increase in repayments from $0 to $561.56, plus 30 cents of income tax.  By earning more the student debtor reduces their take-home pay. Repayment cliffs exist, at less extreme levels, at all 18 income thresholds in the current student debt repayment system.

A total income repayment system produces some very high effective marginal tax rates (EMTR). An EMTR is jargon for how much of an extra dollar earned is lost to income tax, withdrawal of benefits, and in this case HELP repayments. EMTRs are a big issue in Australia’s welfare state, which makes widespread use of means tests – of which the HELP repayment thresholds are a version.

Read More »

The new HELP repayment system and lifetimes of student debt

The prime minister says that a degree should not come with a lifetime of debt. For that goal, the government’s HELP legislation introduced last week is contradictory. It will cut all debt owed as of 1 June 2025 by 20%, which will shorten repayment times for current debtors. But it will also cut annual debt repayments for 99% of debtors, which will lengthen compulsory repayment times for many and push others into the PM’s lifetime of debt.

In the analysis below, female debtors owing $25,000 or more with incomes in the lowest 40% of graduate earnings face an increased risk of a lifetime of student debt. However, what percentage of female debtors actually face a lifetime of debt will depend on initial debt levels and how much their incomes vary through their careers. Voluntary repayments can also affect repayment times.

How the repayment system will change

My previous post on the initial threshold summarised how the repayment system will change. The key elements are that 1) repayment exempt incomes will include everyone on $67,000 or less compared to less than $56,156 now and 2) a marginal rather than total income repayment system will reduce what most debtors repay, particularly at lower income levels.

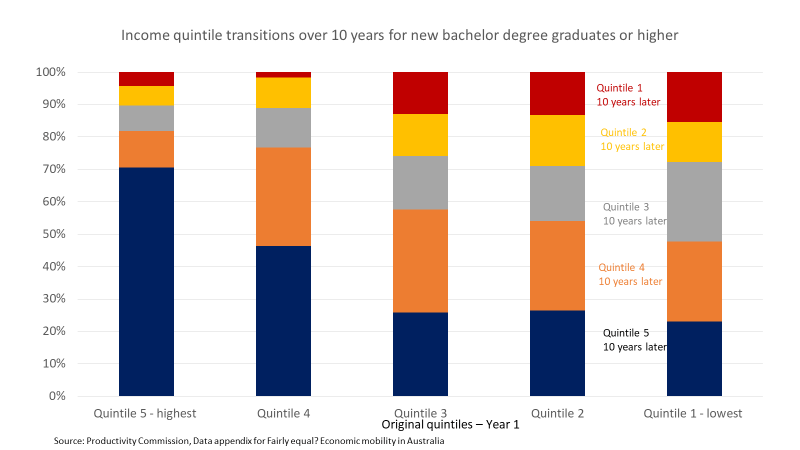
The chart below shows how this will affect HELP debtors at different annual income levels. Based on 2022-23 ATO data I estimate that 99% of debtors repaying under current thresholds will repay less per year than under the current system. The other 1%, all high income earners, will repay the same amount per year as now.

Read More »

The history and politics of the first student debt repayment threshold

The government’s HELP legislation, cutting student debts by 20% and introducing a new repayment system, was introduced into Parliament yesterday. While I have criticisms of the 20% cut, it will be implemented and once done cannot be reversed. The changes to the repayment system will pass now but can, and probably should, be changed at a later date.

In this post I briefly explain how the repayment system will change and then discuss the choice of the first threshold.

The current and proposed student debt repayment systems

Under the current system, repayments start at an annual income of $56,156, at which point student debtors repay 1% of their total income. From there the percentage of income repaid increases incrementally to reach 10% of income at $164,712.

Under the new system repayments start at when income exceeds $67,000. At this point a marginal rate of 15% of income above $67,000 applies up to $124,999, where a marginal rate of 17% applies for income of $125,000 or more. Unexpectedly the bill restores part of the old system with an annual repayment cap of 10% of total income. This avoids some high income earners paying more than now.

The new thresholds will be indexed to growth in average weekly earnings. The current thresholds are indexed to CPI.

The logic of the first threshold

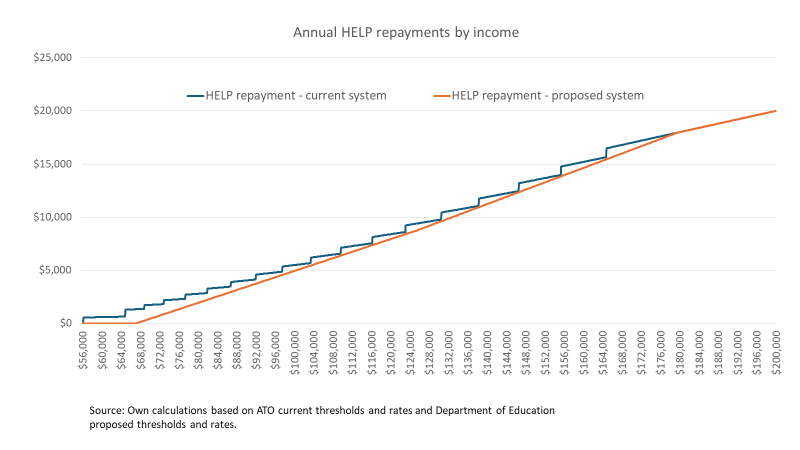
As the chart below shows, in the black dotted line, the first repayment threshold has changed over time. The long-term policy/political tension is between the idea that graduates should enjoy some financial advantage before repaying their student debt and the idea that student debt should be repaid except in cases of financial hardship. The policy pendulum is currently shifting from the latter to the former.

Read More »

Despite an increase in applications for the 2024 academic year, school leaver interest in higher education remained below mid-2010s levels

University applications statistics for 2022 to 2024 were finally released late last week, giving us another data source on demand for higher education.

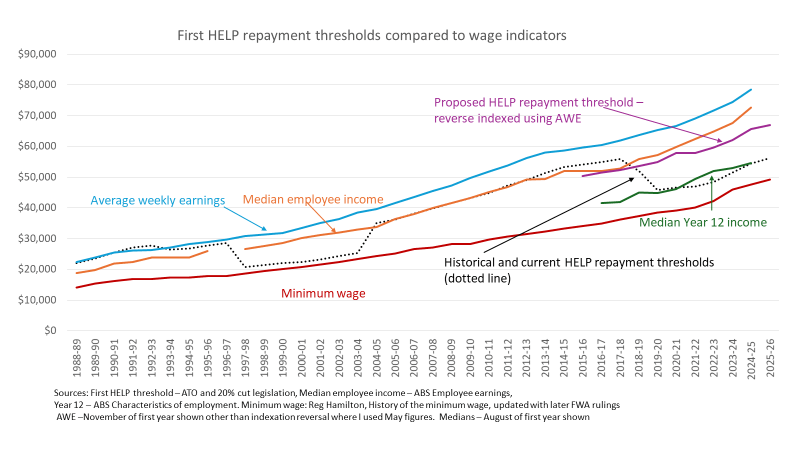
This post focuses on recent school leavers. The chart below shows that applications for this group were up in 2024 on 2023, but that the slump in applications since the late 2010s remained evident – other than the spike for academic year 2021, which is only apparent for teenagers who finished school prior to 2020. This is consistent with people deciding to sit out the COVID recession at university.

That COVID spike meant that in 2021 an unusually large share – 35% – of the 19 and under applicant group were not people who had finished school the year before. This share was 32.5% in each of 2023 and 2024, higher than any year 2012 to 2020, when it averaged 28.4%. This could mean that we are seeing more young people delaying higher education. This data source does not, however, distinguish between people who delayed applying until one or two years after finishing school, and people who enrolled but reapplied to change university and/or course.

Read More »

What is behind increased rates of upfront payment of fees and student contributions?

It’s been a while – seven years – since I took a look at higher education student decisions to take out a HELP loan or pay upfront. Since then we’ve had instability in upfront student contribution payment incentives and increased student debt salience, triggered by high-CPI indexation. Anecdotally some students paid upfront to avoid high indexation of the subsequent debt.

Student contributions & HECS-HELP

The direct incentive to pay student contributions upfront has been framed as a discount. If the upfront discount was 10% and the fee was $1,000 a person who paid upfront would incur a debt of $900. The Commonwealth compensated the university for the lost $100, but avoided holding debt that might go bad and paying interest on its own borrowings to finance lending the student $1,000. In recent years, according to estimates in the Budget papers, about 15% of each year’s lending is not expected to be repaid.

The size of the incentive to pay student contributions upfront has varied over the last 20 years. Any incentive was abolished in 2017, restored for 2021 and 2022 to get Pauline Hanson to vote for Job-ready Graduates, and then abolished again from 2023.

I am in the no upfront discount camp, as I believe most people who pay upfront will do so anyway, whether there is a discount or not.

Read More »

What’s in the 2025 funding agreements? – ‘Higher education courses’ block grants

In February I reported on preliminary university-level 2025 allocations under the Commonwealth Grant Scheme and estimates of student contributions.* These have since been updated to add money for FEE-FREE Uni Ready places and regional university study hubs. The revised funding summary is here.

This post looks at the underlying funding agreements for more detail on the ‘higher education courses’ part of CGS funding. As usual in funding agreements since 2021, the detail reveals a range of legal and policy problems.

A spreadsheet summary of higher education courses funding for 2025 is here.

The role of higher education courses funding

Higher education courses funding is intended, by the Higher Education Support Act 2003, to be a flexible block grant. Within their total funding envelope, expressed as the ‘maximum basic grant amount’ (MBGA), universities can move resources across coursework AQF levels and between fields of education, other than medicine.

Although higher education courses funding is supposed to be flexible, both Coalition and Labor governments have used ad hoc funding agreement conditions to restrict use of higher education courses money to purposes chosen by the government.

This has in turn led to the unlegislated concepts of ‘base MBGA’ and ‘total MBGA’. Total MBGA is actual MBGA under HESA 2003. Base MBGA excludes most ad hoc programs. Its purpose is to reduce expenditure on the higher education continuity guarantee and the current equity plan funding. If universities don’t meet the ad hoc criteria they get $0 for those non-delivered places.

Overall trend in higher education courses funding

To the surprise of universities the first-term Albanese government often treated them harshly. But Labor kept the former government’s promise to index higher education courses funding to CPI. That was 4.1% for 2025. They also kept the Coalition’s region-based funding increases. While there are complex financial flows in and out of higher education courses funding – discussed further in this post – it is up 6.1% between 2024 and 2025 to a total of $7,687,211,975.

Read More »

Mapping Australian higher education 2023 – data update March 2025

Update 20/12/2025: More recent data here.

—————————————————————————————————

I won’t have the capacity to produce another edition of my Mapping Australian higher education report in the foreseeable future, but I am extending the life of the October 2023 edition by updating the data behind the charts.

Mapping‘s chart data is the only publicly-available source of long-term time series data on many higher education topics, especially on financial matters.

I had been waiting on the 2023 university finances report before releasing another chart data update. That finally happened yesterday. Despite a record 27 universities reporting deficits, in the aggregate there was a small surplus, after a loss overall in 2022.

2023 had some weak numbers for the two main Commonwealth student programs, the Commonwealth Grant Scheme and HELP. Several factors were behind this: temporary COVID places coming out of the system, Job-ready Graduates reductions in total funding rates for some courses, and weak domestic demand. These programs trended up in 2024 and 2025, as seen in the chart below, although high CPI-driven indexation was a significant factor.

The updated chart data is available here.

Preliminary 2025 funding per university for Commonwealth supported places

Due to the Department of Education’s under-reporting of higher education funding, last year I consolidated institution-level information into a spreadsheet. There were about 250 downloads each for the original and a subsequent updated spreadsheet, so I decided it was worth doing again this year. The data sources are the funding determinations for the various funding categories.

I emphasised ‘preliminary’ in the post title because the FEE-FREE Uni Ready funding is not yet included. While this is a little frustrating, the upside is that when it is added the amounts involved will be more transparent than might otherwise have been the case. [Update 28/2/25: In Senate estimates yesterday the Department said that FEE-FREE Uni Ready funding equivalent to historical enabling places as of 2022 were included in the funding agreements. Funding for new FEE-FREE Uni Ready places is yet to be released.]

The headline figures to date are Commonwealth Grant Scheme (CGS) – $8.2 billion, estimated HECS-HELP lending of $5.9 billion, and estimated upfront student contributions of $700 million. Overall, about $14.8 billion, with 95% coming from the Commonwealth in cash flow terms. That percentage will go up when we get the FEE-FREE Uni Ready information.

Read More »

Update on Accord student funding policies

With a break between jobs and other things going on I did not comment in December on the Accord-related MYEFO student funding announcements. Compared to last year’s consultation papers, the announcements included a policy change on over-enrolments, more detail on how under-enrolments will be handled, and funding amounts.

Over-enrolments

One of the worst ideas in the June 2024 managed growth consultation paper was a hard cap on Commonwealth supported places. Currently the main CSP category has a soft cap – once a university enrols CSPs valued at its maximum basic grant amount it gets only the student contribution for additional students. These student contribution-only places are known as ‘over-enrolments’. Under a hard capped system over-enrolments would receive zero funding. I explained why hard caps are a bad idea in this post.

In its MYEFO summary the government backed off a little from the hard cap idea. Now universities ‘will continue to receive student contribution amounts for a small proportion of additional students’. The reason given was the practical difficulty of hitting a precise enrolment target. [Update: At a Senate estimates hearing on 27/2/25 the Department said that ‘the overenrolment buffer will be between two per cent and five per cent’.]

Read More »